
US Stock Market Weekly Update: What Happened This Week? (August 10–14, 2026)
Market Overview
The US Stock Market Weekly Update for August 10–14, 2026 shows a U.S. equity market that remained remarkably resilient despite rising geopolitical risks, higher oil prices, mixed economic data, and continued uncertainty surrounding Federal Reserve policy.
The major indexes spent much of the week near record levels. The S&P 500 reached a new all-time closing high of 7,798.99 on Thursday, while the Nasdaq Composite also climbed to a record level. However, Friday brought a modest pullback as weaker-than-expected retail sales and consumer sentiment raised concerns about the strength of the U.S. economy.
Despite Friday’s decline, the weekly picture remained positive for two of the three major indexes.
The S&P 500 gained approximately 0.4% for the week, marking its third consecutive weekly gain. The Nasdaq Composite added about 0.1%, while the Dow Jones Industrial Average declined approximately 0.6%. The Russell 2000 performed better, gaining around 1.1%.
The market’s resilience was supported by strong corporate earnings, continued optimism around artificial intelligence investment, and easing expectations for an immediate Federal Reserve rate increase.
However, investors were also confronted with several warning signs.
Oil prices rose sharply due to ongoing uncertainty in the Strait of Hormuz and U.S.-Iran tensions. Higher energy prices create renewed inflation concerns, while weaker retail sales raise questions about consumer strength.
That created an unusual combination:
Strong stock prices + strong corporate earnings + weaker consumer data + higher geopolitical risk.
Overall, the week can be described as:
Bullish but increasingly cautious.
US Stock Market Snapshot (August 10–14, 2026)
| Market Indicator | Weekly Data |
| S&P 500 – Aug. 14 Close | 7,785.76 |
| S&P 500 Weekly Change | +0.4% |
| S&P 500 Weekly Trend | Bullish |
| Nasdaq Composite – Aug. 14 Close | 26,729.16 |
| Nasdaq Weekly Change | +0.1% |
| Dow Jones – Aug. 14 Close | 53,732.41 |
| Dow Weekly Change | -0.6% |
| Russell 2000 – Aug. 14 Close | 3,068.42 |
| Russell 2000 Weekly Change | +1.1% |
| VIX | Around 14.2–14.3 |
| 10-Year Treasury Yield | Around 4.70% |
| Overall Market Trend | Bullish / Range-Bound |
| Market Sentiment | Cautiously Bullish |
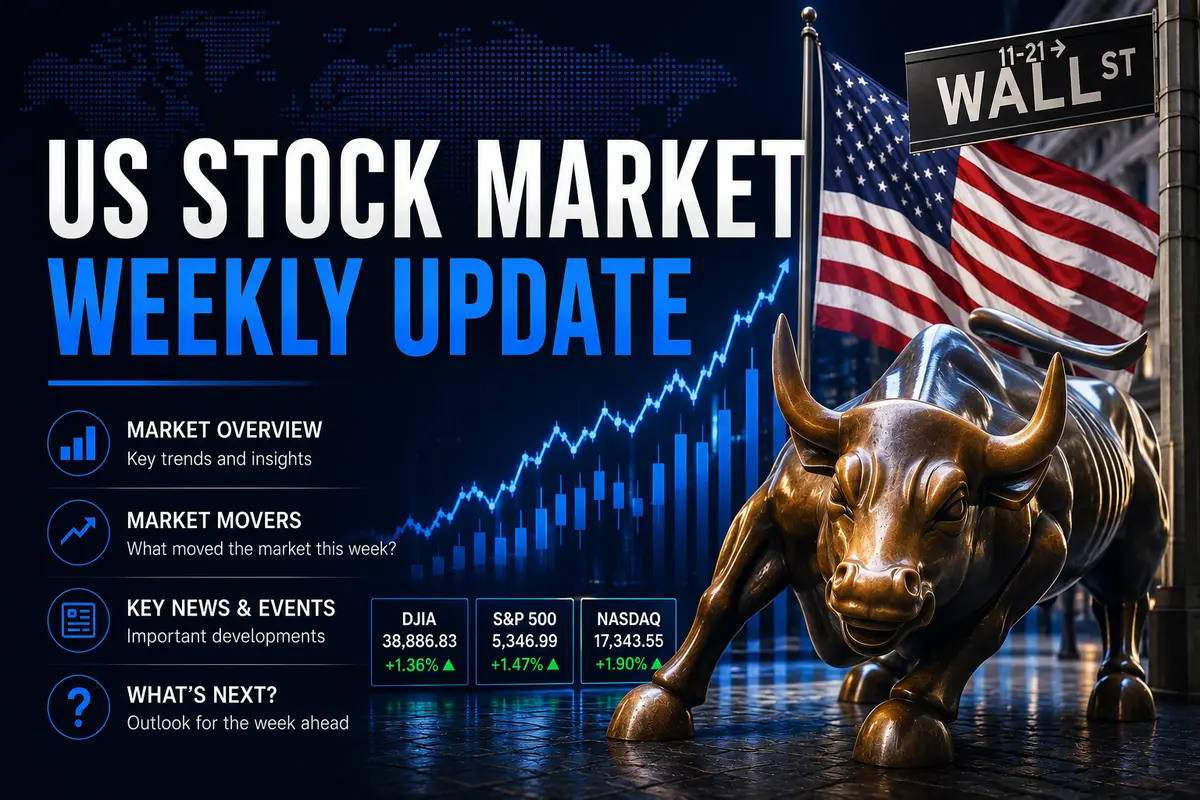
The S&P 500 closed Friday at 7,785.76, the Nasdaq at 26,729.16, and the Dow at 53,732.41. Friday’s session was weaker, but the S&P 500 and Nasdaq still finished the week higher.
The S&P 500’s weekly gain was particularly important because it represented its third consecutive winning week.
Weekly Price Action Summary
Monday, August 10: Wall Street Starts Cautiously
The US Stock Market Weekly Update began with investors taking a cautious approach.
On Monday, the S&P 500 declined by approximately 0.06%, the Nasdaq fell by 0.32%, and the Dow slipped by 0.11%.
The biggest problem was the sharp increase in oil prices.
Brent crude jumped approximately 5% to around $87.72, while WTI climbed to approximately $82.13 as concerns over the Strait of Hormuz intensified.
Higher oil prices immediately raised concerns about inflation.
At the same time, investors were preparing for important U.S. inflation data later in the week.
Technology stocks were also under pressure. Intel fell after announcing a major share sale, while Nvidia declined amid reports surrounding a potential $500 billion AI infrastructure funding initiative.
Energy stocks, however, benefited from the rise in crude prices.
This created an early-week sector rotation:
Energy stronger → Technology weaker → Major indexes relatively stable.
Tuesday, August 11: Investors Await Inflation Data
Tuesday was largely about positioning ahead of the July Consumer Price Index report.
Investors were trying to determine whether inflation was cooling sufficiently to allow the Federal Reserve to become more accommodative.
The market remained close to record levels, but investors were reluctant to make aggressive moves before receiving fresh inflation information.
The major question was straightforward:
Would inflation data reinforce expectations for lower interest rates, or would higher energy prices create another inflation problem?
That question became increasingly important because crude oil was already moving sharply higher.
Wednesday, August 12: CPI Supports Market Confidence
Wednesday delivered one of the week’s most important macroeconomic developments.
The July CPI report did not produce the kind of upside inflation surprise that investors feared.
That helped reinforce expectations that the Federal Reserve would not need to tighten monetary policy aggressively in the near term.
For stock investors, this was positive.
Lower expectations for rate increases are particularly supportive for growth and technology companies because lower interest rates can improve the present value of future earnings.
The S&P 500 therefore maintained its upward momentum.
Thursday, August 13: S&P 500 Reaches a Record
Thursday was the strongest day of the week.
The S&P 500 closed at a new record of 7,798.99, gaining approximately 0.65%.
The Nasdaq Composite climbed 0.81% to 26,803.03, while the Dow gained around 0.13% to 53,839.99.
The rally was supported by July Producer Price Index data that showed wholesale inflation remained relatively contained.
Treasury yields also declined, while the dollar weakened slightly.
That combination was supportive for equities.
Technology and AI-related stocks remained central to the rally, although the sector was not uniformly strong.
SanDisk gained strongly on positive growth expectations, while several companies faced pressure because investors were increasingly demanding evidence that enormous AI investments would translate into sustainable profits.
The S&P 500’s new record demonstrated that investors remained willing to buy stocks despite elevated valuations.
Friday, August 14: Record Highs Give Way to a Pullback
Friday changed the tone slightly.
The S&P 500 fell 0.17% to 7,785.76.
The Nasdaq declined 0.28% to 26,729.16, while the Dow dropped 107.58 points, or 0.20%, to 53,732.41.
The reason was not simply profit-taking.
Investors received disappointing retail-sales data.
U.S. retail sales fell approximately 0.6% in July, significantly weaker than expectations for a modest increase.
That created two opposing interpretations.
Positive interpretation
Weaker consumer demand could reduce inflation pressure and make it easier for the Federal Reserve to maintain or eventually reduce interest rates.
Negative interpretation
A significant slowdown in consumer spending could signal weakening economic growth.
The market therefore reacted cautiously.
At the same time, oil prices increased because of geopolitical tensions, creating another inflationary concern.
Market Sentiment Analysis
The US Stock Market Weekly Update shows that sentiment remained cautiously bullish, but investors became more selective as the week progressed.
Early Week
Neutral / Cautious
Oil prices and geopolitical tensions created uncertainty.
Midweek
Bullish
Inflation data reduced fears of an aggressive Federal Reserve response.
Thursday
Strongly Bullish
The S&P 500 reached another record high.
Friday
Cautious
Weak retail sales and consumer sentiment caused investors to take profits.
Overall
Cautiously Bullish
The market’s underlying momentum remained positive, but valuations and macroeconomic risks prevented investors from becoming aggressively bullish.
Technical Market Analysis
S&P 500
The S&P 500 remains technically strong.
The index finished the week at 7,785.76, only slightly below Thursday’s record close of 7,798.99.
Important Levels
Resistance: 7,800–7,835
First Support: 7,700–7,750
Major Support: Around 7,640
A decisive break above 7,800 could create another momentum leg higher.
However, if the index loses the 7,700 region, investors could begin taking larger profits.
Nasdaq Composite
The Nasdaq finished Friday at approximately 26,729, after reaching a record around 26,803 on Thursday.
Technology remains one of the primary engines of the market.
The biggest question is whether AI-related earnings and capital expenditure can continue supporting the sector’s high valuations.
Key Levels
Resistance: 27,000
Support: 26,300–26,400
A move above 27,000 would strengthen the bullish setup.
Dow Jones Industrial Average
The Dow underperformed the Nasdaq and S&P 500.
It finished Friday at 53,732.41 and lost approximately 0.6% for the week.
The weaker performance reflects the fact that investors continued favoring technology and growth-oriented areas over some traditional cyclical stocks.
Key Levels
Resistance: Around 54,000–54,500
Support: Around 53,000
Russell 2000
Small-cap stocks were one of the week’s stronger areas.
The Russell 2000 gained approximately 1.1%, outperforming the S&P 500 and Nasdaq every week.
This is important because small-cap outperformance can sometimes indicate improving risk appetite.
If the trend continues, it could signal broader market participation rather than a rally concentrated only in mega-cap technology stocks.
Why Did the U.S. Stock Market Rise This Week?
1. Inflation Data Was Less Concerning
The latest inflation data reduced immediate concerns about aggressive Fed tightening.
That supported equities, especially growth stocks.
2. Strong Corporate Earnings
Corporate earnings remained one of the strongest pillars supporting the market.
Reuters reported that around 85% of companies reporting earnings had exceeded expectations, while S&P 500 second-quarter earnings growth was running at approximately 50%.
That is a major reason investors remain willing to pay relatively high valuations.
3. AI Investment Remains Powerful
AI infrastructure continued to attract enormous corporate investment.
Large technology companies and hyperscalers are expected to spend more than $700 billion on AI infrastructure during 2026, according to Reuters.
The market is therefore treating AI as a major long-term growth engine.
However, the sustainability of these investments remains an important risk.
4. Fed Rate-Hike Expectations Declined
The market increasingly expected the Federal Reserve to leave rates unchanged at its September meeting.
Weaker consumer data reinforced that view.
Reuters reported that the probability of a September rate increase had fallen significantly as labor-market and consumer data weakened.
Lower rate expectations generally support equity valuations.
What Created Risk for Stocks?
1. Rising Oil Prices
Oil was one of the biggest threats to the bullish stock-market narrative.
Brent crude gained approximately 5.95% during the week, finishing around $88.52.
Higher oil prices can increase inflation.
That could eventually make it harder for the Federal Reserve to cut interest rates.
2. Weak Retail Sales
July retail sales declined approximately 0.6%, raising concerns about consumer strength.
The U.S. economy is heavily dependent on consumer spending.
Therefore, continued weakness could eventually affect corporate revenue and earnings.
3. High Valuations
The S&P 500 was trading around 20 times forward earnings, up from approximately 19 times in July.
High valuations mean the market needs strong earnings growth to justify current prices.
If earnings disappoint, the downside reaction could be larger.
4. Treasury Yields
The 10-year Treasury yield finished around 4.695%, rising approximately 3.8 basis points over the week.
Higher long-term yields can pressure stock valuations because bonds become more attractive relative to equities.
Sector Performance and Market Rotation
The US Stock Market Weekly Update also highlights an important change beneath the index level.
The market was not moving uniformly.
Stronger Areas
- Energy
- Technology
- Selected AI infrastructure companies
- Small-cap stocks
Weaker Areas
- Some semiconductor stocks
- Healthcare
- Selected consumer-related companies
- Certain high-valuation technology names
Energy was particularly strong as oil prices surged.
Meanwhile, technology remained important but experienced significant stock-specific volatility.
For example, Applied Materials declined around 5.1% despite reporting stronger earnings, showing that investors are increasingly focused on expectations rather than simply headline results.
Institutional Flow Analysis
Institutional investors appeared to remain constructive toward U.S. equities.
The strongest evidence was the market’s ability to recover quickly from short-term selling.
Instead of producing a major correction, weakness was repeatedly met with buying.
This “buy-the-dip” behavior remains an important feature of the current market.
However, investors are becoming more selective.
The S&P 500’s valuation near 20 times forward earnings means institutions increasingly need to distinguish between companies with sustainable earnings growth and companies whose valuations have moved ahead of fundamentals.
The AI sector is the clearest example.
Investors remain excited about AI infrastructure spending, but earnings expectations are already extremely high.
That means even strong earnings can result in stock declines if the outlook does not exceed expectations.
How Does This Affect Investors?
Long-Term Investors
The broader trend remains constructive.
Corporate earnings are strong, AI investment remains powerful, and the S&P 500 continues making record highs.
However, current valuations suggest that investors should avoid assuming the market can rise indefinitely without meaningful pullbacks.
Growth Investors
Technology and AI remain major opportunities.
But the market is becoming less tolerant of disappointing guidance.
Investors should therefore focus on:
- Revenue growth
- Free cash flow
- AI monetization
- Capital expenditure
- Earnings guidance
- Valuation
rather than simply buying companies because they have AI exposure.
Dividend Investors
Higher Treasury yields remain an important consideration.
If bond yields stay elevated, some investors may prefer fixed-income assets over lower-yielding equities.
This can create pressure on expensive defensive and dividend stocks.
Small-Cap Investors
The Russell 2000’s 1.1% weekly gain is encouraging.
If small caps continue outperforming, it could signal improving market breadth.
That would be healthier for the overall market than a rally driven only by a handful of mega-cap technology stocks.
Key Risks Ahead
1. Higher Oil Prices
A sustained rise in crude could increase inflation expectations.
2. Weak Consumer Spending
Further declines in retail sales could raise concerns about economic growth.
3. High Equity Valuations
Expensive valuations leave less room for earnings disappointments.
4. Treasury Yields
Higher long-term yields could pressure technology and growth stocks.
5. AI Spending Concerns
Investors could become concerned that AI capital expenditure is growing faster than AI-related revenue.
6. Geopolitical Escalation
Further U.S.-Iran tensions could increase oil prices and market volatility.
Market Outlook
The US Stock Market Weekly Update entering the next week points toward a cautiously bullish outlook.
Bullish Scenario
The market could continue higher if:
- Inflation remains contained
- Treasury yields stabilize
- Corporate earnings remain strong
- AI spending continues translating into revenue
- Oil prices decline
- The Fed remains supportive
- Small caps continue participating
Under this scenario, the S&P 500 could break decisively above 7,800.
Bearish Scenario
The outlook would weaken if:
- Oil prices move significantly above $90 Brent
- Inflation accelerates
- Treasury yields rise sharply
- Consumer spending continues deteriorating
- AI earnings disappoint
- Geopolitical tensions escalate
Under that scenario, the S&P 500 could retest the 7,700 area and potentially move toward the 7,600s.
Base Case
The most balanced expectation is:
Bullish trend + increased volatility.
The market still has strong earnings support, but valuations and macroeconomic uncertainty mean investors should expect more two-way trading.
Frequently Asked Questions (FAQ)
1. What happened to the U.S. stock market during August 10–14, 2026?
The major U.S. indexes remained near record highs. The S&P 500 gained approximately 0.4%, the Nasdaq rose around 0.1%, while the Dow declined about 0.6% for the week.
2. Why did the S&P 500 reach a record high this week?
The rally was supported by strong corporate earnings, optimism around AI investment, and easing concerns about aggressive Federal Reserve tightening following relatively supportive inflation data.
3. Why did stocks fall on Friday?
Stocks pulled back after July retail sales unexpectedly declined, while higher oil prices and weaker consumer sentiment increased concerns about economic growth and inflation.
4. Is the U.S. stock market still bullish?
Yes, the broader short-term trend remains bullish, but the market is increasingly cautious because valuations are elevated, Treasury yields remain relatively high, and geopolitical risks could increase inflation.
5. What should investors watch next week?
Investors should monitor Treasury yields, oil prices, Federal Reserve expectations, corporate earnings, consumer data, AI-related stocks, and developments surrounding the U.S.-Iran situation.
Final Thoughts
The US Stock Market Weekly Update for August 10–14, 2026 tells a surprisingly resilient story.
The S&P 500 reached another record high.
The Nasdaq remained close to record levels.
Corporate earnings continued to provide strong fundamental support.
And investors continued to show confidence in AI-driven growth.
Yet the market is not without problems.
Friday’s decline highlighted an important contradiction.
The U.S. economy showed signs of softer consumer demand, while oil prices were rising because of geopolitical tensions.
That creates a difficult environment for the Federal Reserve.
If consumer demand weakens, the Fed has more reason to avoid raising interest rates.
But if oil prices rise significantly and push inflation higher, policymakers may have less flexibility.
That tension could become one of the most important market themes during the remainder of August.
The valuation issue is also important.
The S&P 500 is trading around 20 times forward earnings, meaning investors are already pricing in considerable future growth.
As a result, earnings need to remain strong.
The AI investment story is particularly important.
Major technology companies continue spending enormous amounts on data centers, chips, and infrastructure.
If these investments produce strong revenue and profit growth, current valuations could remain justified.
If investors begin questioning the return on those investments, however, technology stocks could experience sharper corrections.
Another encouraging development was the Russell 2000’s outperformance.
Small-cap stocks gained approximately 1.1% during the week, compared with 0.4% for the S&P 500.
Broader participation would make the market’s advance healthier.
For the week ahead, investors should watch several critical signals.
The first is the S&P 500’s 7,800 level.
A sustained breakout above that area would strengthen the bullish trend.
The second is oil.
A continued rise in crude could quickly change the inflation and interest-rate outlook.
The third is Treasury yields.
A sharp increase in long-term yields could pressure expensive growth stocks.
Finally, investors should watch consumer spending.
The July retail-sales decline is not enough by itself to prove that the U.S. economy is entering a major slowdown, but repeated weakness would deserve serious attention.
For now, the overall market remains:
Cautiously Bullish — but increasingly sensitive to inflation, oil prices, valuations and economic growth.
The trend is still upward.
But after reaching repeated record highs, the market has less room for disappointing news.
That makes the next few weeks particularly important for determining whether the current rally can continue or whether investors will finally begin taking larger profits.
If you want to read the June US Stock Market Monthly Update, please click here.
If you want to read last week’s US Stock Market Weekly Update, please click here.
Author Note: This article is crafted by “The Economic Reader editorial team”, dedicated to analyzing the latest market trends, financial updates, and global economic shifts to keep you informed with accurate and comprehensive insights.
Disclaimer: The information provided on this website is for educational and informational purposes only and should not be construed as professional financial, investment, or legal advice. Always consult with a certified financial advisor or professional before making any financial decisions based on this content.