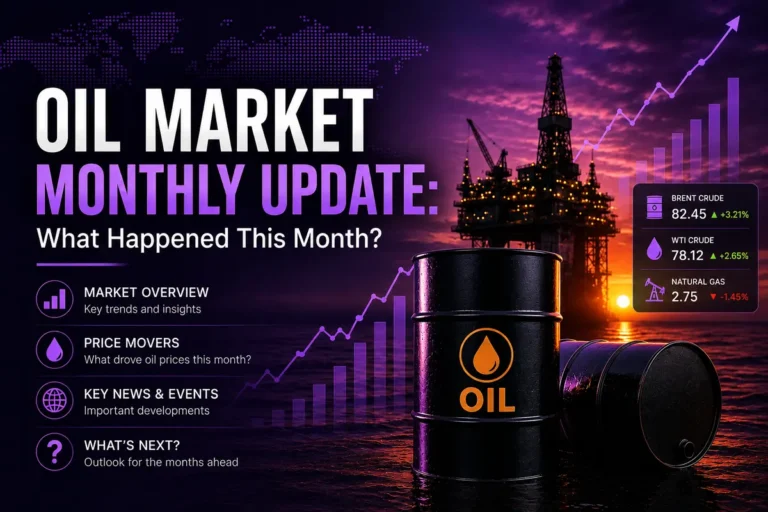

Oil Market Monthly Update: July 2026
Oil Market Monthly Update: Market Overview
The Oil Market Monthly Update for July 2026 tells a very different story from the relatively calm oil market seen at the beginning of the month.
Crude oil entered July near multi-month lows after the sharp second-quarter selloff. On July 1, WTI spot crude was around $69.74 per barrel, while Brent was trading in the low-$70s. The market was still focused on the possibility of improved U.S.-Iran relations, the reopening of key shipping routes, and the risk of excess global supply.
That picture changed dramatically during July.
As tensions between the United States and Iran intensified and shipping through the Strait of Hormuz became increasingly uncertain, crude prices moved sharply higher. By July 23, Brent crude had briefly moved above $100 per barrel, its first move above that level since May. Reuters reported that the move was driven by renewed geopolitical tensions, attacks on shipping and falling traffic through the Strait of Hormuz.
The rally did not last in a straight line.
Brent subsequently fell sharply from the $100 area as traders reassessed the probability and duration of supply disruptions. By July 27, Brent futures had fallen below $90 during the session, while WTI dropped into the low-$80s.
This produced one of the most volatile oil months of 2026.
The fundamental story also became more complicated. Early in July, investors were increasingly worried about a potential supply glut. Later, geopolitical risk became the dominant factor. By the final week, the market was once again balancing geopolitical supply risks against the possibility of improving physical flows and additional OPEC+ production.
The result was a month in which oil prices surged dramatically but ended far below their intramonth peak.
Oil Market Snapshot (July 2026)
| Market Indicator | July 2026 Data |
| WTI July 1 Spot Reference | $69.74/bbl |
| WTI July Monthly Average | $80.46/bbl |
| WTI Late-July Level | Low-to-mid $80s/bbl |
| Brent July 1 Reference | Low-$70s/bbl |
| Brent July Monthly Average | $83.76/bbl |
| Brent July Peak | Above $100/bbl |
| Brent July 31 Reference | Around low-$90s/bbl |
| Monthly Trend | Strongly Bullish but Extremely Volatile |
| Main Driver | Geopolitical supply risk |
| Month-End Sentiment | Cautiously Bullish / Highly Uncertain |
The monthly averages are particularly useful because they provide a more stable view of the market than individual intraday spikes.
According to the U.S. Energy Information Administration’s EIA/FRED historical series, the July 2026 average price was $80.46 per barrel for WTI and $83.76 per barrel for Brent. June averages were $84.81 and $85.40, respectively. That means July’s average price was actually lower than June’s average despite the dramatic late-month geopolitical spike.
This is an important distinction.
The market experienced a major late-July price shock, but because prices started the month near $70 and spent part of the month at relatively low levels, the full-month average remained below June’s average.
That is why investors should not judge July solely by the Brent price temporarily crossing $100.
Weekly Price Action Summary
July 1–5: Oil Starts Near Multi-Month Lows
July began with oil prices still under pressure.
WTI was around $69.74 per barrel on July 1, according to the EIA-derived historical series. The July 2 WTI reading was around $69.73.
Brent was also trading around the low-$70s.
The market was still digesting the major decline from the spring highs.
The initial bearish argument was straightforward:
- OPEC+ was increasing production.
- Non-OPEC supply remained strong.
- Global demand growth was being questioned.
- The market expected improved shipping conditions.
- The geopolitical risk premium had been falling.
Oil therefore entered July looking more like a market concerned about oversupply than scarcity.
That would change quickly.
July 6–12: Geopolitical Risk Returns
The first major change came during the second week of July.
WTI rose from approximately $69.60 on July 6 to around $71.53 on July 7, before moving to approximately $74.56 on July 8 and $79.20 on July 13.
The market was responding to renewed concerns about the U.S.-Iran conflict and shipping through the Strait of Hormuz.
The geopolitical premium returned quickly.
This was significant because the oil market had spent much of June pricing in normalization.
When traders began to believe that normalization might be delayed, crude prices reacted immediately.
OPEC+ also remained important.
Seven OPEC+ countries agreed to increase August production by approximately 188,000 barrels per day, marking another monthly increase.
This created a major conflict in the oil market:
OPEC+ was adding supply at the same time geopolitical risk was threatening supply.
That tension became a defining feature of July.
July 13–19: Oil Moves Above $80
The next stage of the rally was even stronger.
WTI moved above $80 during the middle of July.
The EIA-derived spot series shows WTI at approximately:
- July 14: $80.44
- July 15: $80.73
- July 16: $80.03
- July 17: $83.43
- July 20: $84.38
Brent followed the same trajectory.
On July 17, a reviewed OilPriceAPI market snapshot recorded Brent at approximately $87.86 and WTI at $82.08.
The market was clearly transitioning from the low-$70s into a much more bullish price environment.
At this stage, investors began to focus less on the potential supply glut and more on whether geopolitical disruptions could remove enough barrels from the global market.
July 20–24: The $100 Oil Shock
The most dramatic part of July occurred during the week of July 20–24.
Oil prices accelerated sharply as tensions escalated.
WTI reached approximately $86.04 on July 21 and $87.66 on July 22 in the EIA-derived spot series. By July 23, the WTI spot reference was approximately $93.08.
Brent moved even more aggressively.
On July 23, Brent crude moved above $100 per barrel for the first time since May.
Reuters reported that the move followed attacks by Houthi forces on shipping in the Red Sea, renewed U.S.-Iran military tensions and sharply reduced traffic through the Strait of Hormuz.
Fortune reported Brent around $98.49 early on July 23 after reaching significantly higher levels during the broader move.
The market had effectively repriced the probability of a prolonged supply disruption.
But the move was not sustainable.
On July 24, Brent futures settled around $96.78, down almost 4% on the day, after having settled above $100 in the previous session.
The reversal showed just how headline-sensitive the market had become.
July 25–31: War Premium Begins to Unwind
The final week of July produced another dramatic reversal.
On July 27, Brent fell sharply as markets reacted to renewed hopes of diplomatic progress and improving shipping conditions.
Trading reports showed Brent falling from the previous week’s high near $100 toward the high-$80s and WTI dropping toward the low-$80s.
Investing.com historical data recorded WTI around:
- July 24: $89.24
- July 27: $81.25
- July 28: $80.85
- July 29: $81.03
Brent futures showed a similarly sharp decline:
- July 24: $91.68
- July 27: $85.87
- July 28: $82.26
This was essentially the market removing part of the geopolitical premium.
However, the decline did not mean that geopolitical risk had disappeared.
The market remained extremely sensitive to developments involving the Strait of Hormuz, the Red Sea and Middle Eastern energy infrastructure.
By July 31, Brent was again being quoted around the low-$90s in market reports, while WTI remained in the low-to-mid-$80s.
Market Sentiment Analysis
The Oil Market Monthly Update shows that sentiment moved through three distinct phases during July.
Phase 1: Bearish
At the beginning of the month, investors were worried about oversupply.
WTI was below $70, and Brent was around the low-$70s.
Phase 2: Strongly Bullish
As geopolitical tensions escalated, investors rapidly priced in supply disruption.
Brent’s move above $100 was the clearest sign of this shift.
Phase 3: Cautious
The final week brought a major correction.
The market started questioning whether the geopolitical disruption would last long enough to justify prices near $100.
By month-end, sentiment was therefore best described as:
Cautiously Bullish with Extremely High Volatility.
The bullish case remained supported by geopolitical risks.
The bearish case was supported by the potential return of supply, OPEC+ production growth, and concerns about global demand.
Technical Market Analysis
WTI Support Levels
$80
The $80 level became an important psychological support zone after WTI moved above it during July.
A sustained break below $80 would weaken the late-July bullish structure.
$75
The mid-$70s represent another important support area.
A move back toward this region would indicate that much of the geopolitical premium had been removed.
WTI Resistance Levels
$90
The $90 level became an important psychological barrier.
WTI moved through it during the July geopolitical rally.
$95–$100
This became the major resistance zone.
A sustained move above $100 would signal that the market believes a prolonged supply disruption is becoming increasingly likely.
Brent Technical Structure
Brent’s technical picture was even more dramatic.
Support: $85–$90
The late-July correction brought Brent toward this region.
If the market holds above $85–$90, the broader July recovery remains intact.
Resistance: $95–$100
This became the major resistance zone.
Brent’s brief move above $100 demonstrated that buyers could push through the level, but the rapid reversal showed that the market was not yet comfortable maintaining prices there.
A sustained weekly close above $100 would therefore be much more significant than a brief intraday move.
Why Did Oil Prices Move So Much in July?
1. Strait of Hormuz Risk
The Strait of Hormuz was the single most important geopolitical factor.
The waterway is one of the world’s most important energy chokepoints.
When shipping through the Strait became uncertain, traders immediately priced in a higher probability of physical supply shortages.
This was a major reason Brent moved from around $70 in early July to above $100 later in the month.
2. U.S.-Iran Conflict
The escalation in U.S.-Iran tensions created repeated price shocks.
Every indication of military escalation increased the oil risk premium.
Every indication of negotiations or de-escalation reduced it.
That created an unusually headline-driven market.
3. Red Sea Shipping Attacks
The Red Sea added another layer of risk.
Attacks on shipping increased concern that energy transportation could be disrupted in more than one major maritime corridor.
Reuters specifically linked the July 23 oil rally to Houthi attacks on shipping and the wider geopolitical escalation.
4. OPEC+ Production Increases
OPEC+ was moving in the opposite direction.
The group continued increasing production, with seven members agreeing to raise August output by approximately 188,000 barrels per day.
That created a potential supply cushion.
If geopolitical disruptions ease, additional OPEC+ production could contribute to downward pressure on prices.
5. U.S. Inventories
U.S. petroleum inventories remained another major factor.
The EIA’s latest weekly data available after month-end showed U.S. commercial crude inventories at approximately 407.0 million barrels on July 31.
Inventory levels matter because they provide a practical signal of whether physical supply is becoming tighter or looser.
For August, traders will therefore continue watching weekly inventory reports closely.
Institutional Flow Analysis
The oil market’s institutional positioning during July reflected extreme uncertainty.
When Brent moved above $100, the market was not necessarily pricing in a permanent shortage.
Instead, futures traders were pricing the probability and financial impact of a temporary physical disruption.
That distinction matters.
Oil futures can rise sharply even before a large physical shortage appears in official inventory data because traders price expected future conditions.
The rapid July 27 decline illustrated the reverse.
When traders believed that shipping conditions might normalize, the risk premium disappeared quickly.
This suggests that institutional positioning was highly sensitive to geopolitical headlines rather than driven purely by long-term demand fundamentals.
Supply and Demand Analysis
Supply
Supply conditions were mixed.
Bullish for prices:
- Middle East disruptions
- Hormuz shipping uncertainty
- Red Sea attacks
- Potential pipeline and terminal disruptions
Bearish for prices:
- OPEC+ production increases
- Strong non-OPEC supply
- Potential return of disrupted barrels
- Improving shipping flows
The supply side therefore remained extremely uncertain.
Demand
Demand was less dramatic than the geopolitical story.
Global economic growth remained important, particularly demand from the United States, China and other major consuming economies.
If global growth slows, oil demand could weaken.
This creates a potential ceiling for prices even if geopolitical risk remains elevated.
That is one reason the market struggled to maintain prices above $100.
How Does This Affect Investors?
The Oil Market Monthly Update provides several important lessons for investors.
Energy Stocks
Higher crude prices can support the earnings of upstream oil producers.
However, energy stocks can also become extremely sensitive to geopolitical headlines.
Investors should therefore avoid assuming that a temporary oil-price spike automatically means permanently higher corporate earnings.
Consumers
Higher crude prices can eventually translate into higher gasoline, diesel and transportation costs.
This can increase household expenses.
It can also increase the cost of moving goods, affecting businesses across the economy.
Oil is particularly important because energy costs can feed into broader inflation.
EIA has noted that, all else equal, a sustained $1-per-barrel difference in crude prices can translate into roughly a 2.4-cent-per-gallon difference in petroleum product prices.
This makes oil important not only for energy investors but also for bond and equity investors.
Central Banks
A sustained oil shock can make monetary policy more difficult.
Higher energy prices can increase inflation while simultaneously reducing consumer purchasing power.
That combination creates a challenging environment for central banks.
Key Risks Ahead
1. Further Middle East Escalation
Any renewed attack on energy infrastructure or shipping could quickly push crude higher.
2. Strait of Hormuz Disruption
A prolonged reduction in shipping could create a much larger physical supply problem.
3. OPEC+ Supply Growth
Additional barrels returning to the market could put downward pressure on prices.
4. Global Demand Weakness
A slowdown in major economies could reduce crude demand.
5. Rapid Geopolitical De-Escalation
If negotiations produce a durable agreement, some of the geopolitical premium could disappear quickly.
6. Inventory Changes
Unexpected U.S. inventory builds could reinforce the bearish case.
Unexpected draws could support another rally.
Oil Market Outlook for August
The Oil Market Monthly Update leaves August with an unusually wide range of possible outcomes.
The central question is whether July’s geopolitical shock becomes a temporary price spike or the beginning of a prolonged supply disruption.
Bullish Scenario
Oil could move higher if:
- Strait of Hormuz traffic remains severely restricted
- U.S.-Iran tensions escalate
- Red Sea attacks continue
- Energy infrastructure suffers additional damage
- U.S. inventories decline significantly
- OPEC+ cannot compensate for disrupted supply
Under this scenario, Brent could retest the $100 area.
A sustained break above $100 would indicate that the market believes physical supply risks are becoming structural.
Bearish Scenario
Oil could decline if:
- U.S.-Iran negotiations progress
- Hormuz traffic normalizes
- OPEC+ production increases continue
- U.S. inventories rise
- Global demand weakens
- The geopolitical risk premium continues to unwind
Under this scenario, Brent could return toward the $80s.
Base Case
The most balanced outlook is:
High volatility with a neutral-to-cautiously bullish bias while geopolitical supply risks remain unresolved.
The $85–$90 Brent area is an important support region, while $95–$100 remains the major resistance zone.
For WTI, $80 is an important psychological level, while $90–$95 represents the next major resistance area.
Frequently Asked Questions (FAQ)
1. How did oil prices perform in July 2026?
Oil prices experienced an extremely volatile month. WTI began July near $70, while Brent started near the low-$70s. Brent later moved above $100 as geopolitical tensions intensified before retreating sharply during the final week.
2. What was the average oil price in July 2026?
According to EIA/FRED monthly data, the July 2026 average was approximately $80.46 per barrel for WTI and $83.76 per barrel for Brent.
3. Did Brent crude reach $100 in July 2026?
Yes. Brent crude moved above $100 per barrel on July 23, marking its first move above that level since May.
4. Why did oil prices rise so sharply in July?
The main reason was geopolitical supply risk. Renewed U.S.-Iran conflict, reduced Strait of Hormuz traffic, and attacks on Red Sea shipping increased fears of disruptions to global oil supplies.
5. What should oil investors watch in August 2026?
Investors should watch Strait of Hormuz shipping, U.S.-Iran negotiations, Red Sea security, OPEC+ production, U.S. crude inventories, global demand and the Brent $95–$100 resistance zone.
Final Thoughts
The Oil Market Monthly Update for July 2026 was one of the clearest examples of how quickly geopolitical risk can transform an energy market.
At the beginning of July, WTI was trading around $70, and Brent was in the low-$70s.
The market was worried about oversupply, increasing OPEC+ production, and weaker demand.
Three weeks later, Brent had briefly crossed $100.
That enormous move was not caused by a sudden structural change in global oil consumption.
It was largely driven by the changing probability of supply disruption.
The Strait of Hormuz became the center of the market’s attention.
When traders believed that energy flows were threatened, they rapidly increased the geopolitical premium.
When the probability of de-escalation increased, that premium disappeared just as quickly.
The most important lesson from July is therefore that oil prices were trading both the physical supply balance and the probability of geopolitical disruption.
The EIA/FRED monthly data provides another useful perspective.
Despite the dramatic late-month rally, the average July price was $80.46 for WTI and $83.76 for Brent, both below their June monthly averages.
That tells investors not to confuse a dramatic intramonth spike with the average conditions of the entire month.
For August, the market remains highly dependent on geopolitical developments.
If the Strait of Hormuz continues operating with significant restrictions, Brent could challenge $100 again.
If diplomatic progress leads to more normal shipping conditions, prices could retreat toward the $80s.
Meanwhile, OPEC+ production increases and U.S. inventory data will determine whether the physical market can absorb additional geopolitical shocks.
For investors, the most important levels are straightforward:
Brent: $85–$90 support and $95–$100 resistance.
WTI: $80 support and $90–$95 resistance.
The broader conclusion is that July did not create a simple bullish or bearish oil market.
It created a high-volatility market where geopolitical risk, physical supply, inventories and OPEC+ decisions are competing for control of prices.
That environment is likely to continue into August.
If you want to read the June Oil Market Monthly Update, please click here.
If you want to read last week’s Oil Market Weekly Update, please click here.
Author Note: This article is crafted by “The Economic Reader editorial team”, dedicated to analyzing the latest market trends, financial updates, and global economic shifts to keep you informed with accurate and comprehensive insights.
Disclaimer: The information provided on this website is for educational and informational purposes only and should not be construed as professional financial, investment, or legal advice. Always consult with a certified financial advisor or professional before making any financial decisions based on this content.