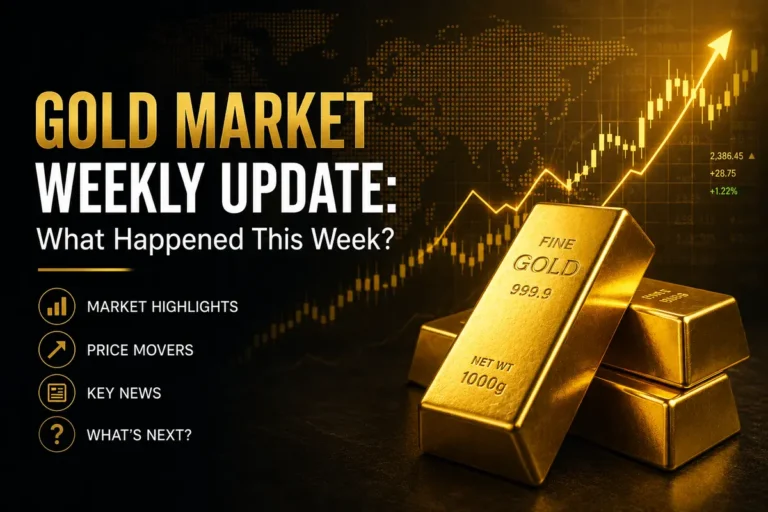
Gold Market Monthly Update: What Happened in June 2026?
Gold Market Monthly Update: Market Overview
The Gold Market Monthly Update for June 2026 shows one of the sharpest corrections in the gold market during the first half of the year.
Gold entered June at historically elevated levels after an extraordinary rally earlier in 2026. The metal had reached a record LBMA Gold Price of $5,405 per ounce on January 29, while spot gold reached an intraday record of $5,595.47. By late June, however, the market had experienced a dramatic reversal.
On June 1, a historical spot-price series recorded gold closing at approximately $4,540.71 per ounce. By June 30, Reuters reported spot gold at $4,027.03 per ounce during the final trading session of the month. That represents a decline of roughly 11.3% based on those two reference prices, broadly consistent with Reuters’ report that gold had fallen about 11.2% during June.
The correction was not caused by one single factor.
Instead, several forces worked together:
- Higher interest-rate expectations
- Persistent U.S. inflation concerns
- Higher Treasury yields
- Changes in Federal Reserve expectations
- U.S. dollar movements
- Profit-taking after the earlier gold rally
- Changes in geopolitical risk
- Short-term investor positioning
The decline became particularly significant in the final third of the month.
Spot gold briefly fell below the psychologically important $4,000-per-ounce level, reaching an intraday low of $3,959.33 on June 24, according to the World Gold Council. The LBMA Gold Price reached a low of $4,001.80 on June 25.
This distinction is important because spot gold and the LBMA benchmark are not the same price series.
Therefore, the June low should not be presented as one universal number for every gold market.
The broader conclusion, however, is clear: June was a major correction month for gold.
Gold Market Snapshot: June 2026
| Market Indicator | June 2026 Data |
| June 1 Gold Close | ≈ $4,540.71/oz |
| June 30 Spot Gold | ≈ $4,027.03/oz |
| June Monthly Change | ≈ -11.2% to -11.3% |
| Spot Gold Intraday Low | $3,959.33/oz |
| LBMA Gold Price Low | $4,001.80/oz |
| June 30 U.S. Gold Futures Settlement | $4,038.50/oz |
| Monthly Trend | Strongly Bearish |
| Key Psychological Level | $4,000/oz |
| Month-End Sentiment | Bearish / Cautious |
The Gold Market Monthly Update data shows just how quickly sentiment changed.
Gold started June around the mid-$4,500 area but finished the month close to $4,000.
The difference was more than a normal monthly fluctuation.
It represented a major repricing of expectations surrounding monetary policy, inflation and geopolitical risk.
The World Gold Council described gold’s first half as a “rollercoaster ride.” By June 26, gold was down around 7% year-to-date from the beginning of the year despite having previously reached record levels above $5,500 intraday.
Weekly Price Action Summary
June 1–5: Gold Starts the Month Near $4,500
Gold entered June at a relatively elevated level.
A historical price archive records a June 1 closing price of approximately $4,540.71 per ounce.
At this point, the market was still digesting the extraordinary rally from earlier in the year.
Investors had already seen gold move dramatically higher, creating substantial unrealized gains for holders who had entered the market earlier.
That created an environment where profit-taking could become increasingly important.
At the same time, investors were paying close attention to U.S. monetary policy.
Gold is a non-yielding asset, meaning it does not provide interest income.
When investors expect interest rates and bond yields to remain high, the opportunity cost of holding gold increases.
This was one of the key themes that would dominate June.
June 8–12: Macro Pressure Increases
The second week of June brought additional pressure to the gold market.
Investors increasingly focused on inflation and the possibility that the Federal Reserve could maintain restrictive monetary policy for longer.
This was particularly important because gold had previously benefited from expectations of easier monetary policy.
As those expectations weakened, the metal became more vulnerable.
By June 22, Reuters reported spot gold at approximately $4,182.39 per ounce, after the market had touched its lowest level since June 11 during the previous session. U.S. gold futures for August delivery settled at $4,202.70.
The price decline was therefore already substantial before the final week of June.
June 15–19: Gold Moves Toward the $4,000 Area
Selling pressure intensified during the middle of the month.
The market was increasingly concerned that inflationary pressure could prevent the Federal Reserve from easing monetary policy quickly.
The situation became more complicated because geopolitical developments were affecting energy prices.
When oil prices rise sharply, investors can become concerned that inflation will remain elevated.
That creates an unusual environment for gold.
Gold is traditionally considered an inflation hedge, but rising inflation can also cause central banks to maintain higher interest rates.
Higher rates can weigh on gold.
Reuters noted that energy prices had become an important short-term driver for precious metals during June.
This created a chain reaction:
Higher oil prices → inflation concerns → higher-rate expectations → stronger pressure on gold.
June 22–26: The Major Gold Sell-Off
The final full week of June was the most important part of the correction.
Gold moved rapidly toward and then below the $4,000 psychological level.
The World Gold Council reports that spot gold reached an intraday low of $3,959.33 on June 24, while the LBMA Gold Price reached $4,001.80 on June 25.
This is the most important correction to the earlier version of this article.
The $3,959.33 figure represents the spot gold intraday low.
The $4,001.80 figure represents the LBMA Gold Price low.
They should not be treated as identical benchmarks.
The break below $4,000 was psychologically important.
Once a major round-number support level is broken, technical traders can become more defensive.
Momentum selling can also increase when investors who bought at higher prices begin reducing positions.
The result was a much faster decline than the market had experienced earlier in June.
June 29–30: Gold Stabilizes Near $4,000
The final two sessions of June showed signs of stabilization.
On June 30, Reuters reported that spot gold had risen about 0.3% to $4,027.03 per ounce by 1:40 p.m. ET, after touching its lowest level since November earlier in the session. U.S. gold futures settled nearly unchanged at $4,038.50.
The stabilization did not mean the bearish trend had ended.
Instead, it suggested that buyers were beginning to appear around the $4,000 region.
The market ended June with a very different technical structure from the one it had at the beginning of the month.
Gold had moved from the mid-$4,500s to approximately $4,000.
Those left investors asking whether the market was entering a new long-term bearish phase or simply completing a major correction after an exceptional rally.
Market Sentiment Analysis
The Gold Market Monthly Update reveals a dramatic shift in investor sentiment throughout June.
Early June: Cautiously Bullish
Gold was still trading above $4,500, and the longer-term bullish narrative remained powerful.
Mid-June: Neutral to Bearish
Higher yields, inflation concerns and changing rate expectations increasingly pressured prices.
Late June: Strongly Bearish
The break toward and below $4,000 accelerated technical selling.
Month-End: Bearish but Potentially Oversold
By June 30, the market remained technically weak, but the size of the correction meant investors were increasingly looking for signs of stabilization.
The World Gold Council noted that gold’s first-half performance demonstrated its sensitivity to macroeconomic conditions, geopolitical risk and investor sentiment.
Technical Market Analysis
$4,000: The Most Important Psychological Level
The $4,000 area became the central technical level for gold entering July.
Spot gold briefly moved below it during June.
For the market to establish a stronger recovery, gold would need to reclaim and hold this level consistently.
A sustained move below $4,000, on the other hand, would suggest that the correction could continue.
$3,950–$4,000: Major Support Zone
The June spot intraday low of $3,959.33 created an important support reference.
A decisive break below this zone would be technically negative.
If buyers successfully defend the region, however, it could become the foundation of a new short-term trading range.
$4,100–$4,200: First Recovery Resistance
The $4,100–$4,200 area became an important resistance zone after the June decline.
A recovery through this region would indicate that selling pressure was weakening.
$4,500: Major Long-Term Resistance
The $4,500 area remained an important reference because gold began June around this region.
A return toward $4,500 would represent a substantial recovery from the late-June lows.
The World Gold Council’s mid-year analysis suggested that gold could trade around the $4,100 area under a macro-consensus scenario, while a stronger catalyst could potentially help gold resume an upward trend toward approximately $4,500.
Why Did Gold Fall in June 2026?
1. Higher Interest-Rate Expectations
One of the biggest factors was the changing outlook for U.S. interest rates.
Investors became increasingly concerned that the Federal Reserve might need to keep rates higher for longer.
Reuters reported on June 30 that markets were pricing a significant probability of a September rate hike, reflecting concerns about persistent inflation.
Higher rates generally create pressure on gold because the metal does not generate interest income.
2. Inflation Concerns
Inflation remained above the Federal Reserve’s 2% target.
This created a difficult situation.
Investors might normally buy gold when they are concerned about inflation.
But if inflation causes the Fed to maintain or increase interest rates, gold can simultaneously face pressure from higher yields.
That is exactly the type of environment gold encountered during June.
3. Treasury Yields
Treasury yields were another important driver.
Higher yields increase the opportunity cost of holding gold.
The World Gold Council specifically identifies opportunity cost as one of the major drivers of gold performance, noting that gold tends to benefit when bond yields fall, the U.S. dollar depreciates, and faces pressure in the opposite environment.
4. U.S. Dollar Movements
Gold is priced internationally in U.S. dollars.
A stronger dollar generally makes gold more expensive for buyers using other currencies.
That can reduce demand at the margin.
The dollar therefore remained an important part of the June gold story.
5. Profit-Taking
Gold had already experienced an extraordinary rally earlier in 2026.
The World Gold Council recorded a January 29 LBMA high of $5,405 and a spot intraday high of $5,595.47.
Investors who had accumulated gold earlier therefore had significant gains to protect.
Once momentum weakened, profit-taking likely contributed to the speed of the correction.
6. Geopolitical Developments
Geopolitical developments remained important, but their impact on gold was complicated.
Gold can benefit from geopolitical uncertainty because investors often seek safe-haven assets.
However, geopolitical tensions can also push oil prices higher.
Higher oil prices can increase inflation expectations and therefore interest-rate expectations.
That creates an unusual situation in which geopolitical risk can simultaneously support gold through safe-haven demand while pressuring it through higher inflation and yields.
June demonstrated this conflict clearly.
Institutional Flow Analysis
The institutional picture was mixed.
Short-term investors were reducing risk as gold moved sharply lower.
However, the long-term structural case remained supported by central-bank demand and portfolio diversification.
The World Gold Council’s mid-year research emphasized the relationship between gold returns and investment and central-bank demand. It also noted that organic demand from consumers, long-term investors and central banks has historically helped support gold after substantial pullbacks.
This is an important distinction.
A major price correction does not necessarily mean institutional interest in gold has disappeared.
Instead, different investor groups can have very different time horizons.
Short-term traders may sell because of technical weakness.
Central banks and long-term reserve managers may continue accumulating gold because their objectives are strategic rather than short-term.
Central Bank Demand
Central bank demand remained one of the strongest structural arguments supporting gold.
The World Gold Council’s June research reported that reserve managers continued to see gold as an important component of their reserves.
The broader survey found that 89% of reserve managers expected global central-bank gold holdings to increase over the following 12 months, while 45% expected their own institutions to increase gold holdings.
This suggests that the long-term diversification trend remained intact even while gold prices were undergoing a major correction.
For investors, this is an important reason not to interpret June’s decline in isolation.
Physical Gold Demand
Lower prices can eventually attract physical buyers, but demand does not automatically surge the moment prices fall.
Consumers and investors often wait for signs that the market has stabilized before increasing purchases.
This creates an important feedback mechanism.
If gold stabilizes around $4,000, lower prices could encourage additional physical and investment demand.
If gold continues falling rapidly, however, buyers may remain cautious because they expect even lower prices.
The behavior of Asian consumers and investors therefore remained important for the next stage of the market.
The World Gold Council has highlighted Asia as an increasingly important source of support for gold prices during 2026.
How Does This Affect Investors?
Long-Term Gold Investors
June demonstrated that even a strong long-term gold market can experience very large corrections.
Investors should therefore avoid assuming that gold will rise continuously simply because central banks are buying.
Interest rates, yields, the dollar and investor positioning can produce significant short-term price movements.
Diversified Portfolio Investors
Gold can still serve as a diversification asset, but June showed that it should not be treated as a guaranteed hedge against every form of market stress.
Its performance depends on the interaction between:
- Interest rates
- Inflation
- Currency movements
- Geopolitical risk
- Investor demand
- Central-bank purchases
Short-Term Traders
For traders, the $3,950–$4,000 zone became particularly important.
A successful defense could create a short-term recovery setup.
A decisive break below the June low, however, would increase downside risk.
Key Risks Ahead
1. Higher-for-Longer Interest Rates
If the Federal Reserve maintains restrictive policy for longer than expected, gold could remain under pressure.
2. Rising Treasury Yields
Higher yields can increase the opportunity cost of holding gold.
3. Stronger U.S. Dollar
Further dollar strength could create additional headwinds.
4. Continued Investor Selling
Persistent ETF and institutional outflows could delay a meaningful recovery.
5. Break Below $3,959
A decisive break below the June spot intraday low could trigger another round of technical selling.
6. Weak Physical Demand
If consumers and long-term investors fail to respond to lower prices, gold could struggle to establish a durable floor.
7. Geopolitical and Oil Volatility
A renewed geopolitical escalation could support safe-haven demand but simultaneously increase oil prices and inflation expectations.
Gold Market Outlook for July 2026
The Gold Market Monthly Update for June leaves July with a highly uncertain but potentially important setup.
The market had already experienced a decline of roughly 11% during June.
That means much of the speculative excess from the earlier rally had been removed.
Bullish Scenario
The bullish scenario would strengthen if:
- Gold holds above $3,950–$4,000
- Treasury yields decline
- The U.S. dollar weakens
- Fed rate-hike expectations decrease
- ETF flows improve
- Central-bank demand remains strong
- Geopolitical risks increase
Under this scenario, gold could potentially recover through:
$4,100 → $4,200 → $4,400 → $4,500
Bearish Scenario
The bearish scenario would become stronger if:
- Gold breaks decisively below $3,950
- Treasury yields rise
- The dollar strengthens
- Fed rate-hike expectations increase
- Investment demand weakens further
- Geopolitical developments push oil prices higher without creating enough safe-haven buying
In that environment, gold could experience another significant correction.
Base Case
The most balanced view entering July was:
Neutral to cautiously bullish above $4,000, but with elevated volatility.
The first objective for buyers would be to reclaim $4,100–$4,200.
A sustained recovery above that zone would improve the technical structure.
A failure to hold $4,000 would keep the bearish trend intact.
Frequently Asked Questions (FAQ)
1. How did gold perform in June 2026?
Gold experienced a major correction in June. A historical price series recorded a June 1 close of approximately $4,540.71, while Reuters reported spot gold around $4,027.03 during the final trading session on June 30. This represents a decline of roughly 11.3%, broadly consistent with Reuters’ reported 11.2% June decline.
2. What was the lowest gold price in June 2026?
The World Gold Council reports that spot gold reached an intraday low of $3,959.33 on June 24. The LBMA Gold Price reached a low of $4,001.80 on June 25. These are different benchmarks and should not be treated as the same price.
3. Why did gold fall below $4,000 in June?
Gold fell because several negative forces combined, including higher interest-rate expectations, persistent inflation concerns, Treasury yields, dollar movements and profit-taking after the earlier rally. Geopolitical developments also affected oil prices and inflation expectations.
4. Did central banks continue to support gold?
Yes. Central-bank demand remained an important structural support for gold. The World Gold Council’s research indicates that reserve managers continued to view gold as an important reserve-diversification asset, even during the June price correction.
5. What gold price levels should investors watch next?
The most important short-term levels are approximately $3,950–$4,000 on the downside and $4,100–$4,200 on the upside. A sustained recovery above $4,200 would improve the short-term technical picture, while a decisive break below the June spot low of $3,959.33 would increase downside risk.
Final Thoughts
The Gold Market Monthly Update for June 2026 was ultimately a story of rapid repricing after an extraordinary rally.
Gold entered June around $4,500 and finished the month close to $4,000.
That was a substantial decline.
But the most important lesson is not simply that gold fell.
The important question is why it fell.
The correction was driven by the interaction between monetary policy, inflation, Treasury yields, the U.S. dollar, geopolitical developments and investor positioning.
The Federal Reserve became a particularly important source of pressure.
As markets increasingly considered the possibility of higher rates, the opportunity cost of holding a non-yielding asset increased.
At the same time, geopolitical tensions pushed oil prices higher, creating another inflationary concern.
This produced a difficult environment for gold.
Gold’s traditional role as an inflation hedge was challenged by the fact that higher inflation could lead to tighter monetary policy.
That is one of the most important macroeconomic lessons from June.
The technical damage was also significant.
Spot gold fell to $3,959.33 intraday on June 24, while the LBMA Gold Price reached $4,001.80 on June 25.
The $4,000 level therefore became the key psychological battleground.
By June 30, spot gold had recovered slightly to around $4,027.03, while U.S. gold futures settled at $4,038.50.
This stabilization did not confirm a new bull market.
But it did suggest that buyers were beginning to pay attention to lower prices.
The long-term picture was also more balanced than the monthly price chart might suggest.
Central-bank demand remained an important structural source of support, while the World Gold Council continued to emphasize gold’s strategic role as a portfolio diversifier and reserve asset.
For investors, June therefore provided a useful reminder:
Gold can have strong long-term fundamentals and still experience a major short-term correction.
The two ideas are not contradictory.
Going into July, the key question was whether gold could establish a durable base around $4,000.
If buyers successfully defended the $3,950–$4,000 region and the macroeconomic environment became more supportive, gold could attempt a recovery toward $4,100 and $4,200.
If the market broke decisively below the June low, however, the correction could become deeper.
The most reasonable outlook was therefore not aggressively bullish or aggressively bearish.
It was cautiously neutral with a close focus on the $4,000 support zone.
June had reset the gold market.
July would determine whether that reset became the beginning of a new accumulation phase—or simply another stage in a larger correction.
Don’t miss out on key market movements! Read our market insights on Gold, Oil, Crypto, and Stock markets.
Author Note: This article is crafted by “The Economic Reader editorial team”, dedicated to analyzing the latest market trends, financial updates, and global economic shifts to keep you informed with accurate and comprehensive insights.
Disclaimer: The information provided on this website is for educational and informational purposes only and should not be construed as professional financial, investment, or legal advice. Always consult with a certified financial advisor or professional before making any financial decisions based on this content.