Contango vs Backwardation Explained: How the Futures Curve Affects Commodity Returns
Contango vs Backwardation Explained
Commodity prices are often discussed as if there is only one price that matters. In futures markets, however, the same commodity can have different prices for different delivery dates.
That series of prices forms the futures curve.
Two terms are especially important when reading that curve: contango and backwardation.
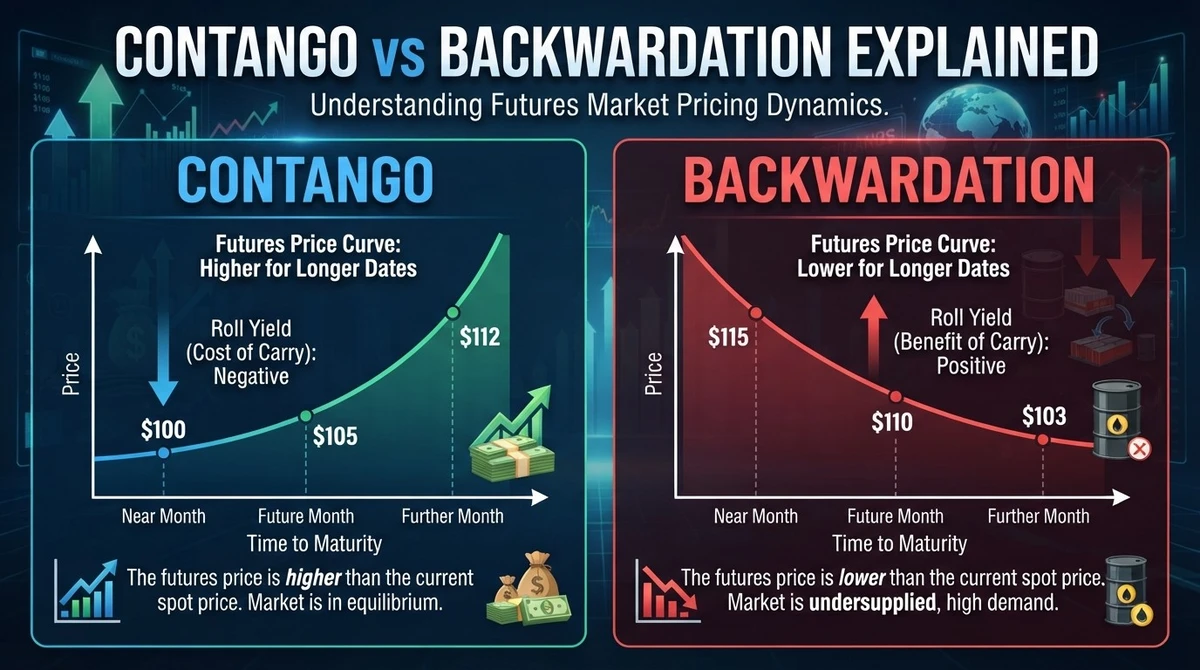
In contango, futures prices are generally higher for later delivery than for nearer delivery. In backwardation, nearer-term futures prices are higher than later contracts. The CFTC defines contango as a market in which successive delivery months are priced progressively higher, while backwardation describes progressively lower prices in more distant months. (CFTC)
These conditions matter because investors who gain commodity exposure through futures do not necessarily receive the same return as the commodity’s spot price.
The difference can come from the process of replacing expiring futures contracts, commonly called rolling.
Understanding contango and backwardation therefore helps explain an important commodity-investing question: Why can a commodity rise while a futures-based investment produces a much smaller gain?
What Are Contango and Backwardation?
The simplest way to understand the two concepts is to compare prices across delivery dates.
Contango occurs when futures prices are above the current spot price, or when later-dated futures contracts trade above nearer contracts. This generally produces an upward-sloping futures curve.
Backwardation occurs when futures prices are below the spot price, or when nearer contracts trade above later contracts. This generally produces a downward-sloping or inverted curve.
For example, imagine crude oil has these prices:
| Contract | Price |
| Spot | $70 |
| One-month futures | $72 |
| Three-month futures | $74 |
| Six-month futures | $77 |
The curve slopes upward. This is a simplified example of contango.
Now consider:
| Contract | Price |
| Spot | $70 |
| One-month futures | $68 |
| Three-month futures | $66 |
| Six-month futures | $64 |
The curve slopes downward. This is a simplified example of backwardation.
The curve is not a guaranteed forecast of where the commodity’s future spot price will end up. It reflects current pricing for different delivery periods and the market conditions affecting those contracts.
The Futures Curve Explained
A futures contract specifies the terms for buying or selling a commodity at a future date, although many contracts are closed or offset before physical delivery.
Because contracts have different delivery months, a commodity market can have several futures prices at the same time.
An oil market, for example, might have contracts for:
- October delivery
- November delivery
- December delivery
- January delivery
- February delivery
Plotting those prices creates the futures curve.
The curve can be:
- Upward sloping – generally associated with contango
- Downward sloping – generally associated with backwardation
- Relatively flat – when price differences between contracts are small
The shape can also change. A market that is in contango today can later move into backwardation, while a backwardated market can flatten or return to contango.
CME explains that futures curves can change as market participants reassess supply, demand, storage conditions, financing costs, and expectations about future prices. (CME Group)
Contango: When Later Futures Contracts Cost More
Contango is often associated with the economics of carrying a physical commodity.
Holding inventory can involve:
- Storage
- Insurance
- Financing
- Transportation
- Other carrying costs
For physically delivered commodities, these costs can contribute to higher prices for later delivery.
Imagine an oil trader holding physical crude for several months. Storage costs money, capital is tied up, and the inventory needs to be insured.
If those carrying costs are significant, later-dated futures can trade above the current spot price.
That does not mean every contango market is caused by storage costs alone. Expectations about future supply and demand, inventories, financing conditions, and other market forces also affect the curve.
The useful idea is that holding the physical commodity has a cost, and the futures curve can reflect part of that economics.
Backwardation: When Near-Term Futures Cost More
Backwardation is the opposite curve structure.
Near-term contracts trade at higher prices than contracts for later delivery.
One reason this can happen is that immediate access to a commodity becomes especially valuable.
Suppose an unexpected supply disruption reduces the amount of crude available to buyers right now. Refineries that need crude immediately may be willing to pay more for prompt delivery, while prices for delivery several months ahead remain lower.
The result can be a backwardated curve.
CME describes the value of having physical material available when inventories are tight as a convenience yield. When inventories are low, the benefit of holding physical inventory can become more significant. (CME Group)
This creates an important distinction:
Contango is often associated with the cost of carrying inventory, while backwardation can reflect the value of having the commodity available immediately.
A Simple Example of Contango
Suppose a futures-based oil fund holds a near-term contract priced at $70.
As that contract approaches expiration, the fund needs to replace it with a later contract.
Assume the next contract costs $73.
If the underlying market has not otherwise changed, the fund must sell the expiring contract and buy the new one at a higher price.
For a simplified example:
- Contract being sold: $70
- New contract being purchased: $73
- Difference: $3
Maintaining similar futures exposure therefore requires buying the replacement contract at a higher price.
That creates a negative roll effect, all else equal.
The actual return will depend on the movement of both contracts, the timing of the roll, fund expenses, and other factors. But the example shows why persistent contango can create a headwind for a long futures position.
A Simple Example of Backwardation
Now suppose the near-term contract is $70 while the next contract costs $67.
A fund holding the near-term contract can sell it at $70 and purchase the later contract at $67.
For a simplified example:
- Contract being sold: $70
- New contract being purchased: $67
- Difference: $3
The replacement contract costs less, creating a positive roll effect, assuming other factors remain unchanged.
That is the basic mechanism behind positive roll returns in a backwardated market.
CME research has documented how backwardation can contribute positive roll returns for long futures positions, while contango can create a negative roll effect. (CME Group)
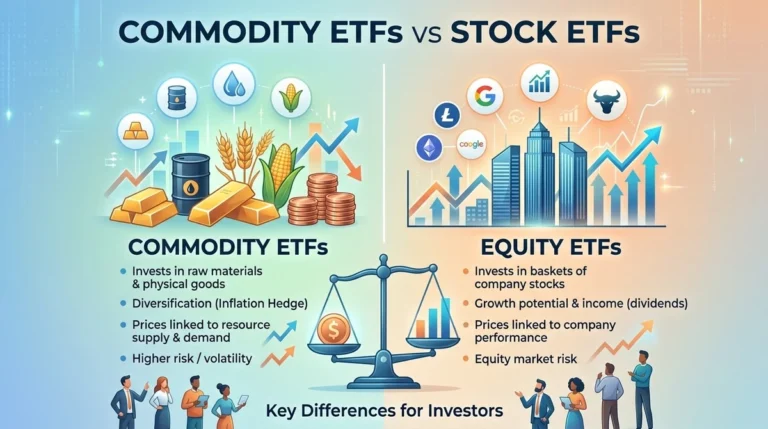
Why Commodity ETFs Can Be Affected
This is where the futures curve becomes particularly important for investors.
Some commodity exchange-traded products obtain exposure through futures rather than holding the physical commodity.
An oil futures fund, for example, does not necessarily own barrels of crude. Instead, it may hold futures contracts and replace them as they approach expiration.
That creates two important sources of performance:
- Changes in futures prices
- The effect of rolling from one contract to another
The second factor can become significant over time.
As a result, a futures-based commodity product can produce a return that differs from the commodity’s spot-price change.
Economic Reader’s Best Commodity ETFs in the USA explains the difference between physically backed products and futures-based commodity funds.
Roll Yield: Where the Difference Becomes Important
Roll yield refers to the gain or loss associated with replacing one futures contract with another.
A simplified framework looks like this:
Contango → cheaper expiring contract replaced with a more expensive later contract → negative roll effect
Backwardation → more expensive expiring contract replaced with a cheaper later contract → positive roll effect
The calculation is more complicated in real markets because futures prices move continuously, funds use different rolling schedules, and transaction costs and management expenses can affect returns.
Still, roll yield explains an important part of the gap between a futures-based investment and the spot commodity.
CME research shows that the difference between a simple front-month price series and the return from actually holding and rolling futures can become substantial over time. (CME Group)
Why Contango Can Hurt Long-Term Commodity Returns
Contango does not automatically mean the commodity itself will fall.
A commodity can rise in spot price while its futures curve remains in contango.
The issue for a long futures investor is the repeated cost of moving exposure into more expensive contracts.
Imagine a commodity’s spot price rises 10% over a period. If the investor repeatedly encounters a negative roll effect, the actual investment return can be considerably lower than that 10% spot-price increase.
The reverse can also occur. A commodity may have only a modest spot-price gain while positive roll returns from backwardation add to the total futures return.
That is why a spot-price chart does not always tell the full story for a futures-based investment.
Why Backwardation Can Help – But Not Always
Backwardation can create a positive roll effect for a long futures position.
That does not make backwardation a guaranteed source of profit.
The underlying commodity can fall sharply while the curve remains backwardated.
For example, suppose:
- Spot price falls from $80 to $70
- The market remains backwardated
- Positive roll returns partially offset the decline
The investor can still lose money.
There is also no guarantee that backwardation will persist. CME notes that a backwardated curve can strengthen, weaken, disappear, or even move into contango. (CME Group)
Roll yield is therefore one component of total return rather than a substitute for analyzing the commodity itself.
What Causes Contango?
Several forces can contribute to contango.
High Inventories
When inventories are plentiful, the immediate value of holding additional physical supply can be relatively low.
That can reduce convenience yield and make carrying costs more visible in the futures curve.
Storage Costs
Oil, metals, agricultural products, and other physical commodities can require storage.
Those costs can influence the difference between current and future prices.
Financing Costs
Holding inventory ties up capital. Interest rates and financing conditions can therefore affect the economics of carrying a commodity.
Weak Near-Term Demand
If immediate demand is relatively soft while market participants expect conditions to improve later, deferred contracts may trade at higher prices.
Expectations About Future Supply
Expectations of greater future production or availability can also affect later-dated contracts.
These factors can operate at the same time, so the curve usually reflects a combination of market forces rather than one isolated cause.
What Causes Backwardation?
Backwardation often appears when immediate supply becomes especially valuable.
Low Inventories
When inventories are tight, physical supply can command a premium because buyers have fewer alternatives.
CME notes that convenience yield tends to rise as inventories fall because the benefit of owning physical material becomes more valuable. (CME Group)
Supply Disruptions
A mine shutdown, crop failure, pipeline outage, production cut, export restriction, or geopolitical event can tighten near-term supply.
Strong Near-Term Demand
Demand that rises faster than supply can respond can push nearby contracts higher.
Seasonal Demand
Some commodities have strong seasonal patterns.
Heating demand can affect natural gas, while agricultural markets respond to planting, harvesting, and weather cycles.
Limited Immediate Availability
The market does not only care about how much of a commodity exists over the next year. It also cares about how much is available right now.
That difference can produce a steeply backwardated curve.
Storage, Inventory and Convenience Yield
One of the most useful concepts for understanding futures curves is convenience yield.
Physical ownership can provide an operational benefit that is difficult to capture through a futures contract alone.
A refinery holding crude, for example, can continue operating when prompt supplies become scarce. A manufacturer with critical metal inventory can keep production running when obtaining additional material becomes difficult.
That operational value is part of the economic reasoning behind convenience yield.
When inventories are abundant, the benefit of holding additional physical supply tends to be smaller.
When inventories are scarce, immediate access becomes more valuable.
A useful framework is therefore:
Higher inventories → lower convenience yield → greater potential for contango
Lower inventories → higher convenience yield → greater potential for backwardation
This is a framework rather than a mechanical rule, because interest rates, storage costs, expectations, seasonality, and other factors also influence the curve.
Can the Futures Curve Change Quickly?
Yes.
The curve can change as market expectations and physical conditions change.
A sudden supply disruption can push nearby prices higher and create backwardation. If the disruption is resolved and inventories recover, the curve can flatten or move toward contango.
Recent CME research on energy markets illustrates how quickly these conditions can change. Its 2026 analysis notes that backwardation can strengthen, weaken, collapse, or flip into contango as market conditions evolve. (CME Group)
For investors, that means today’s roll conditions are not necessarily tomorrow’s.
A fund that benefits from backwardation today could face a very different return environment later if the curve changes.
Contango vs. Backwardation in Different Commodities
The same curve terminology applies across commodity markets, but the forces behind it can be very different.
Crude Oil
Oil is a useful example because inventories, storage capacity, production disruptions, transportation constraints, and geopolitical events can all affect the curve.
CME’s research shows how tight oil-market conditions can produce strong backwardation and positive roll returns. (CME Group)
Natural Gas
Natural gas futures can be heavily influenced by weather, storage levels, production, pipeline capacity, electricity generation, and industrial demand.
Seasonality can make the curve particularly important.
Gold
Gold futures have different economics from commodities with major industrial storage and immediate-use requirements.
Interest rates, financing conditions, investor demand, and the relationship between physical and futures markets can all influence the curve.
Agricultural Commodities
Agricultural markets are affected by harvest cycles, weather, inventories, transportation, export flows, and seasonal demand.
A curve can therefore reflect very different conditions depending on where the market is in its crop cycle.
The broader point is that contango and backwardation describe the structure of the market; they do not explain the entire market by themselves.
How Investors Can Read a Futures Curve
Investors do not need to become professional futures traders to understand the basic information in a futures curve.
A practical checklist is enough.
1. Is the Curve in Contango or Backwardation?
Compare nearby contracts with later-dated contracts.
2. How Steep Is the Curve?
A mildly upward-sloping curve and a sharply upward-sloping curve can create very different roll conditions.
3. Is the Shape Changing?
A curve that is rapidly flattening or steepening can provide more information than its current shape alone.
4. What Are Inventories Doing?
Inventory data can help explain whether the physical market is becoming tighter or more comfortable.
5. What Is Driving the Commodity?
Look at production, demand, weather, geopolitics, transportation, and seasonality relevant to that market.
6. How Does the Investment Product Roll?
Two funds tracking similar commodities can use different contracts or rolling methodologies.
That difference can affect their returns even when they appear to provide similar exposure.
Contango and Backwardation Are Not Buy or Sell Signals
It is tempting to reduce the relationship to:
Contango = bad
Backwardation = good
That is too simple.
Contango can occur while the underlying commodity is rising. Backwardation can occur while the commodity later falls.
The curve is one piece of market information.
Investors also need to consider:
- Supply and demand
- Inventories
- Interest rates
- Currency conditions
- Geopolitical risks
- Seasonality
- The underlying commodity
- The structure of the investment product
For a futures-based ETF, the curve matters because of its effect on rolling contracts. But the movement of the underlying futures price remains a major part of total return.
Understanding the Curve Before Investing
Contango and backwardation are more than technical futures-market terms. They help explain why commodity exposure and commodity returns are not always the same thing.
A long futures position in contango can face a negative roll effect when expiring exposure is replaced with a more expensive later contract.
A long futures position in backwardation can benefit from a positive roll effect when a more expensive near-term contract is replaced with a cheaper later contract.
Neither condition guarantees a profit or loss.
Before investing in a futures-based commodity ETF or other futures-linked product, investors can check:
- What commodity does it track?
- Does it use futures or physical holdings?
- Which contracts does it use?
- How frequently does it roll?
- Is the curve in contango or backwardation?
- How steep is the curve?
- What are inventories doing?
- What is driving the current market?
- What fees and other costs apply?
For a broader explanation of futures contracts, expiration, margin, settlement, and commodity trading mechanics, see Economic Reader’s How Does Commodity Trading Work?.
The key idea is simple: the commodity’s spot price is only one part of the return equation when futures are involved.
The shape of the futures curve can change the result along the way.