What Happened to the U.S. Economy in October 2026? Full Economic Review
What Happened to the U.S. Economy October 2026?
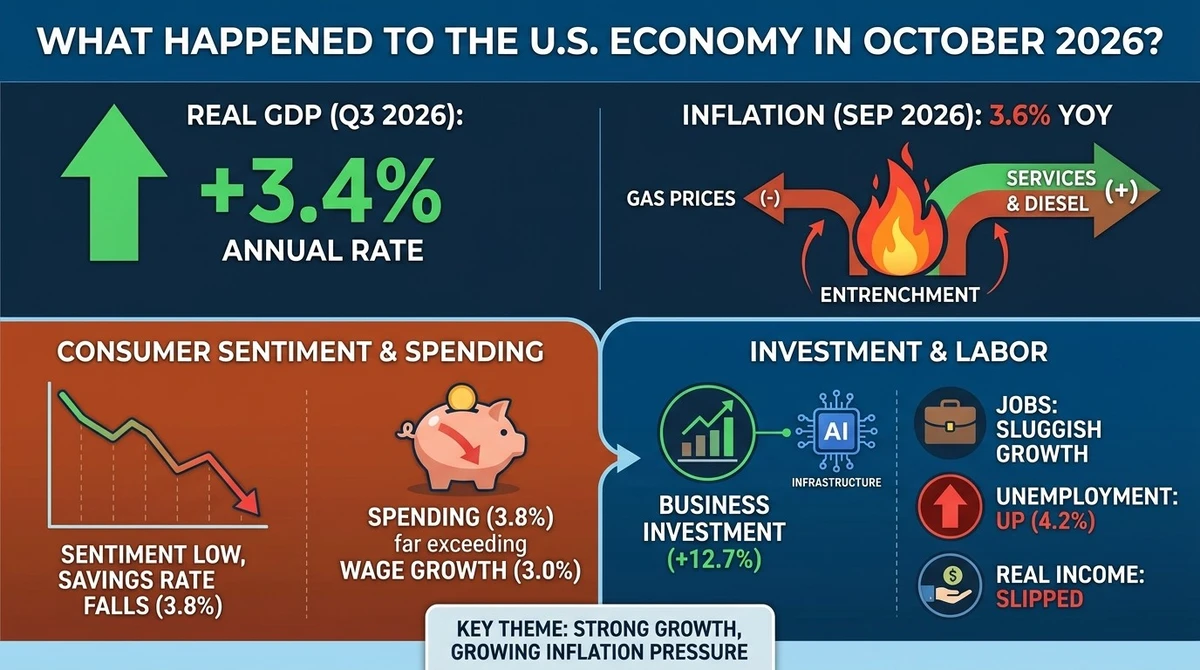
The U.S. economy closed October 2026 with a contradiction at its center. Economic growth accelerated, business investment remained strong, and consumer confidence recovered. Yet households were still dealing with rising prices, weak real income growth, and a labor market that was adding relatively few jobs.
The contrast was visible in the latest figures available during the month. Third-quarter GDP expanded at an annualized rate of 3.4%, but September real consumer spending increased by less than 0.1%. Inflation accelerated, and the Federal Reserve kept interest rates unchanged while acknowledging that price pressures remained elevated.
These figures do not describe an economy in recession. They point to something more complicated: an economy with considerable production and investment momentum, but less consistent improvement in the financial conditions experienced by households.
Strong GDP Growth Was Not the Whole Story
The most encouraging economic release of October came on October 29, when the Bureau of Economic Analysis reported that real U.S. GDP increased at an annualized rate of 3.4% in the third quarter. That compared with 2.2% growth in the second quarter.
Investment, consumer spending, and government spending contributed to the expansion. Exports declined, while imports increased, reducing the contribution from net trade.
One figure offered a more revealing view of domestic demand. Real final sales to private domestic purchasers, which combines consumer spending and private fixed investment, increased at a 4.9% annualized rate, up from 4.6% in the previous quarter.
That measure suggests that private domestic activity was stronger than the headline GDP figure alone might imply. Businesses continued investing, while household spending remained an important part of economic activity.
However, GDP measures the value of goods and services produced across the economy. It does not show how evenly the resulting income is distributed or whether household purchasing power is improving at the same rate.
The October data made that distinction particularly important. The economy was expanding, but the latest household income and spending figures showed that the benefits of growth were not translating into equally strong improvements in everyday financial conditions.
Source: BEA – GDP Advance Estimate, Third Quarter 2026.
Inflation Took a Larger Bite Out of Household Budgets
The September Consumer Price Index, released on October 14, showed that inflation had accelerated.
Headline CPI increased 0.6% during September, following a 0.4% increase in August. Over 12 months, consumer prices rose 3.7%. Core CPI, which excludes food and energy, increased 0.3% during the month and 2.6% over the year.
Energy was the largest immediate source of pressure. Gasoline prices increased 9.1% in September, accounting for more than half of the monthly increase in headline CPI. The overall energy index rose 5.2%, while shelter costs increased 0.4%.
This was not simply a case of consumers paying more for a few isolated products. Higher fuel costs affect transportation, delivery, business operations, and the cost of moving goods through supply chains. Those effects can eventually influence prices beyond the energy category.
The distinction between headline and core inflation also matters for monetary policy. Energy prices can move sharply from month to month, but persistent increases in housing and services costs are harder to dismiss as temporary fluctuations.
The BEA’s separate Personal Consumption Expenditures price index, the Federal Reserve’s preferred inflation measure, also showed pressure. September PCE inflation was 3.6% year over year, while core PCE inflation reached 3.1%.
The two measures use different methods and expenditure weights, so their rates should not be treated as interchangeable. Together, however, they showed that inflation remained well above the Fed’s 2% objective.
Sources: BLS – CPI, September 2026; BEA – Personal Income and Outlays, September 2026.
Household Spending Increased, but Real Income Did Not Keep Pace
The September Personal Income and Outlays report, released on October 29, exposed one of the month’s clearest economic tensions.
Personal consumption expenditures increased 0.5% in current-dollar terms. Spending on goods rose by $35.1 billion, while services spending increased by $78.1 billion.
After adjusting for inflation, however, real PCE increased by only $2.6 billion, or less than 0.1%. Real disposable personal income declined 0.3% during the month.
The difference is significant. Consumers were spending more dollars, but the amount of additional goods and services they could purchase was much smaller. Higher prices absorbed much of the increase in nominal spending.
The personal saving rate stood at 3.8%, with personal saving totaling $911.1 billion. A relatively low saving rate does not automatically indicate financial distress, but it leaves less room for some households to absorb unexpected expenses or a prolonged increase in living costs.
For businesses, the distinction between nominal and real demand is equally important. Higher sales revenue can reflect price increases rather than stronger sales volumes. Companies may report growing revenues while facing customers who are becoming more selective about purchases.
This is why the September spending figures deserve attention alongside the stronger GDP report. Private domestic demand was supporting economic growth, but household purchasing power was not advancing at the same pace.
A Weak Hiring Month Changed the Labor-Market Picture
The September employment report, released on October 2, showed that nonfarm payroll employment increased by just 29,000 jobs. The unemployment rate remained at 4.2%, with approximately 7.1 million people unemployed.
Employment changed little across most major industries. Health care added 23,000 jobs, construction added 11,000, and manufacturing increased by 9,000. Financial activities lost 7,000 positions.
Revisions to earlier figures made the employment picture weaker. July payroll growth was revised from an increase of 21,000 to a decline of 10,000. August growth was revised down from 162,000 to 133,000. Together, the revisions reduced previously reported employment gains by 60,000.
Average hourly earnings increased 3.0% over the year, reaching $37.81 in September. But that nominal wage increase needs to be considered alongside inflation.
The Employment Cost Index, released on October 30, provided another indication of the pressure. Private-industry compensation costs increased 3.4% over the year, while wages and salaries rose 3.1%. After adjusting for inflation, private-industry wages and salaries were down 0.6% over the year.
The labor market was therefore not showing widespread job losses, but hiring was weak and real wage growth was under pressure. That combination can make households cautious even when the unemployment rate remains relatively stable.
Sources: BLS – Employment Situation, September 2026; BLS – Employment Cost Index, September 2026.
Consumer Confidence Improved Without Resolving Financial Concerns
The Conference Board’s October Consumer Confidence Index rose 7.5 points to 91.7, compared with a revised 84.2 in September. The Present Situation Index increased to 120.4, while the Expectations Index reached 72.6.
The survey indicated that consumers had become more positive about current business conditions, job availability, and their future income prospects. The share of respondents describing jobs as plentiful increased to 26.7%, from 24.3% in September.
But the improvement in confidence should not be confused with a comparable improvement in household finances.
The survey’s preliminary results were based on responses collected from October 1 through October 21. It measured consumers’ perceptions and expectations, not their actual spending or income.
That distinction helps explain why confidence could recover while real disposable income declined and real spending barely increased. Consumers may feel less pessimistic about the direction of the economy without having more money available after paying for essentials.
For retailers and service businesses, confidence can influence future purchasing decisions. Whether that optimism turns into stronger real consumption will depend partly on employment, wages, borrowing costs, and the path of inflation.
Source: The Conference Board – Consumer Confidence, October 2026.
The Federal Reserve Faced a Difficult Policy Choice
On October 28, the Federal Reserve kept its federal funds target range at 3.75% to 4.00%. The decision passed by a 10–2 vote.
The Committee described economic activity as expanding at a strong pace. It cited resilient domestic spending, strong productivity growth, and robust capital investment. It also said inflation remained elevated.
The two dissenting members, Lisa D. Cook and Beth M. Hammack, preferred a quarter-percentage-point rate increase.
The decision reflected competing economic signals. Strong GDP growth and persistent inflation argued against easing monetary policy too quickly. Meanwhile, weak payroll growth and declining real disposable income raised concerns about the resilience of household demand.
Keeping rates unchanged gave policymakers more time to evaluate incoming information. But it also meant that borrowing costs remained relatively restrictive for households and businesses using credit.
Higher interest rates can help moderate demand and reduce inflationary pressure, but they also increase the cost of mortgages, business financing, and other loans. If the labor market weakens further, maintaining restrictive financial conditions could create additional pressure on economic activity.
The Fed therefore faced a difficult balance: it needed to prevent elevated inflation from becoming entrenched without unnecessarily weakening an economy that was still expanding.
Source: Federal Reserve – FOMC Statement, October 28, 2026.
What the October Data Means for November
The next stage of the economic outlook depends on whether strong business activity can translate into more durable improvements in household finances.
Several releases scheduled for November will help clarify the direction:
- Labor market: The October Employment Situation report is scheduled for November 6. It will show whether September’s weak hiring was temporary or part of a broader slowdown.
- Inflation: October CPI is scheduled for November 10. Energy prices and shelter costs will be important indicators to watch.
- Productivity: The third-quarter productivity and costs report is scheduled for November 5. Productivity growth could help businesses expand output without generating equivalent increases in labor costs.
- Consumer spending and income: The BEA’s October Personal Income and Outlays report is scheduled for November 25, providing a more direct assessment of household spending and real income.
These releases will help determine whether October’s combination of strong GDP and weak household purchasing-power indicators continues into the final months of the year.
If employment and real income improve while inflation moderates, consumer demand could become a more sustainable source of growth. If hiring remains weak and prices continue rising faster than wages, households may become more cautious, even if business investment keeps GDP expanding.
The U.S. Economy Was Growing, but Households Were Still Under Pressure
October’s economic evidence did not point to an economy in broad contraction. Third-quarter GDP accelerated, private domestic demand remained strong, and consumer confidence recovered.
Yet the household picture was less convincing. September real PCE barely increased, real disposable income declined, private-sector real wages were lower than a year earlier, and payroll growth was limited.
That gap is the most important feature of the October review. Economic growth can remain strong when investment and other components of output expand, even as households experience pressure from prices and modest wage gains.
The coming months will show whether the strength in production and investment spreads more broadly through the labor market and household incomes. Until then, the U.S. economy should be understood as resilient, but uneven: strong in aggregate output, less reassuring in the purchasing power of many households.
Read the What Happened to the U.S. Economy in September 2026? for more details.