Best Commodity Analysis Tools: 10 Platforms and Data Sources to Know
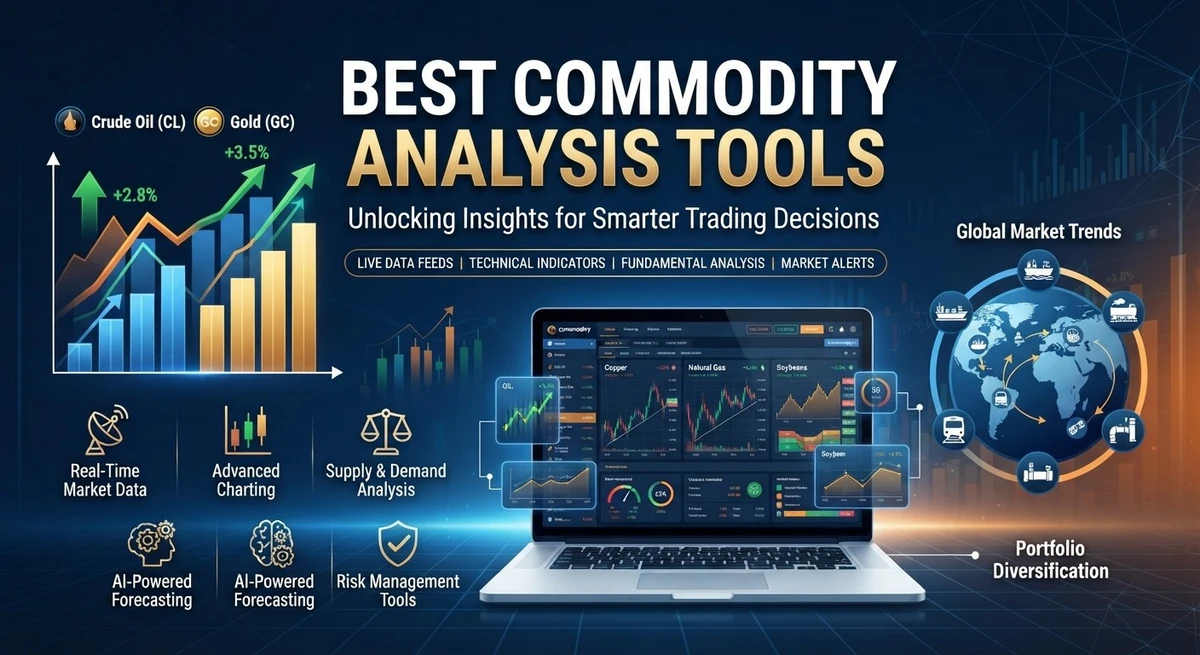
Best Commodity Analysis Tools
Commodity markets can move quickly, but understanding why they move requires more than watching a price chart.
An oil price can rise because inventories are falling. Copper can gain when demand remains firm while mine supply struggles to expand. Wheat can react to weather, crop estimates, or changes in export flows. Gold can respond to interest rates, the U.S. dollar, geopolitical uncertainty, and investment demand.
That is why commodity analysis usually requires several types of information.
Price charts show what happened. Supply and demand data can help explain why it happened. Futures positioning can show how market participants are positioned, while inventory data can provide clues about whether a physical market is becoming tighter or looser.
The best commodity analysis tools are therefore not necessarily the platforms with the most charts. The useful ones are those that help answer specific questions about price, supply, demand, inventories, positioning, and market expectations.
This guide covers 10 widely useful platforms and data sources for analyzing energy, agricultural commodities, metals, futures markets, and broader commodity trends.
What Makes a Commodity Analysis Tool Useful?
Before comparing individual platforms, it helps to separate commodity research into a few basic categories.
A useful source may provide:
- Current and historical prices
- Production data
- Consumption and demand data
- Inventory information
- Import and export data
- Weather and crop information
- Futures prices and curves
- Trading volume and open interest
- Futures positioning
- Market forecasts
- Economic and geopolitical context
- Charts and technical indicators
No single platform provides all of these.
An oil analyst may need petroleum inventories from the U.S. Energy Information Administration, futures prices from an exchange, and positioning data from the Commodity Futures Trading Commission.
An agricultural analyst may need USDA crop estimates, FAO global food data, weather information, and futures prices.
The goal is therefore not to find one perfect website. It is to match the source to the question being researched.
1. EIA: Energy Market Data
The U.S. Energy Information Administration is one of the most useful sources for analyzing energy commodities, particularly crude oil, petroleum products, and natural gas.
Its open-data system provides time-series information across major energy categories, while its market reports cover production, consumption, inventories, imports, exports, prices, and other measures. EIA Open Data
For natural gas, EIA data includes production, consumption, imports and exports, prices, pipeline movements, and underground storage.
For petroleum markets, analysts can examine crude production, petroleum stocks, refinery activity, imports, exports, and prices.
What makes EIA useful?
EIA is particularly valuable when the question is whether an energy market is becoming tighter or looser.
For example, falling crude inventories alongside firm demand can provide important context for higher oil prices. Natural-gas storage data can similarly help analysts compare current supply conditions with historical patterns.
EIA is especially useful for:
- Crude oil
- Natural gas
- Gasoline
- Diesel
- Heating oil
- Petroleum products
- U.S. energy markets
For energy commodities, official supply and inventory data is often far more informative than relying on a price chart alone.
2. USDA: Agricultural Supply and Demand Data
Agricultural commodities require a different approach because production depends heavily on weather, acreage, yields, inventories, and trade flows.
The U.S. Department of Agriculture’s World Agricultural Supply and Demand Estimates (WASDE) is one of the key sources for this type of analysis. USDA publishes regular estimates covering major agricultural commodities and global supply-and-demand conditions. USDA WASDE reports
The USDA’s Economic Research Service also provides a WASDE projections dashboard updated with current estimates. USDA WASDE projections
What can USDA data reveal?
A major question is whether expected supply is changing relative to demand.
An increase in projected production can put downward pressure on prices if inventories are also expected to rise. A reduction in expected yields, exports, or ending stocks can have the opposite effect.
USDA data is especially useful for:
- Corn
- Wheat
- Soybeans
- Rice
- Cotton
- Sugar
- Livestock
- Other agricultural commodities
This is why agricultural commodity analysis cannot rely on price charts alone. Crop conditions and supply estimates can change the interpretation of a market move.
3. FAO: Global Food and Agricultural Markets
The Food and Agriculture Organization of the United Nations provides a broader international perspective on agricultural commodities.
FAO monitors global markets for major agricultural commodities and publishes analysis of supply, demand, trade, and other market conditions. Its markets-and-trade resources cover cereals, oilcrops, sugar, coffee, meat, dairy, rice, cotton, and other commodities. FAO Markets and Trade
Its FAO Food Price Index measures monthly changes in international prices for a basket of food commodities. The index is useful for monitoring broader movements across global food markets rather than focusing on one crop. FAO Food Price Index
Why use FAO alongside USDA?
USDA data can provide detailed information on U.S. and global agricultural supply and demand. FAO adds a broader international perspective.
That distinction matters because agricultural commodities are heavily traded across borders.
FAO data is particularly useful for:
- Global food prices
- Cereals
- Vegetable oils
- Sugar
- Dairy
- Meat
- International agricultural trade
- Global food-market trends
Economic Reader’s Top 10 Agricultural Commodities provides additional context on why major agricultural commodities matter to the global economy.
4. World Bank: Commodity Prices and Global Outlook
The World Bank’s Commodity Markets resources are useful when the goal is to understand commodity markets from a global macroeconomic perspective.
The World Bank publishes commodity price data, historical series, forecasts, and its Commodity Markets Outlook. Its database covers energy, metals, agriculture, fertilizers, precious metals, and other major commodity categories. World Bank Commodity Markets
This makes the World Bank particularly useful for comparing commodity groups rather than analyzing only one market.
For example, the World Bank’s latest published data showed that energy prices rose 8.8% in August 2026, while metals increased 4.0% and precious metals rose 8.8%. (World Bank)
What makes the World Bank useful?
It helps answer a broader question:
Is a commodity move part of a wider global trend, or is it specific to one market?
That distinction can matter when oil, metals, food, and precious metals are moving at different speeds.
The World Bank is especially useful for:
- Global commodity comparisons
- Long-term historical data
- Commodity forecasts
- Global macroeconomic research
- Developing-market analysis
- Broad commodity trends
It also provides downloadable historical price data, which makes it useful for research beyond day-to-day market monitoring.
5. CFTC: Commitments of Traders Data
Price data tells you where a commodity has traded. CFTC Commitments of Traders (COT) data provides a different perspective: how different categories of market participants are positioned in futures markets.
The CFTC’s disaggregated reports divide reportable positions into categories including producers/merchants, swap dealers, managed money, and other reportable traders. CFTC Commitments of Traders
Historical COT data is also available for longer-term analysis. CFTC Historical COT Reports
How can COT data help?
It can show how positioning has changed over time.
For example, an analyst can compare changes in managed-money positions with movements in crude oil, gold, wheat, or other futures markets.
But positioning should not be treated as a standalone price forecast.
A heavily long market can continue rising, while a heavily short market can continue falling. COT data is most useful when combined with price, fundamental, and futures-curve information.
6. CME Group: Futures Prices, Settlements and Open Interest
CME Group is an important source for commodity futures data across energy, metals, agriculture, and other markets.
Its market-data resources include daily settlement prices, volume, and open interest. CME says settlement prices play an important role in price discovery and risk management. CME Group Market Data
Its daily volume and open-interest reports can also help analysts track changes in market activity. CME Daily Volume and Open Interest
Why does this matter for commodity analysis?
Futures prices allow analysts to look beyond today’s spot price.
Comparing different contract months can reveal the shape of the futures curve. Volume and open interest can add another layer of information about market participation.
For example, a trader studying crude oil might examine the front-month contract, later delivery months, volume, and open interest together rather than focusing on one headline price.
Economic Reader’s Contango vs. Backwardation Explained explains why the futures curve matters for commodity markets and investment returns.
CME data is particularly useful for:
- Crude oil
- Natural gas
- Gold
- Silver
- Copper
- Agricultural futures
- Futures curves
- Settlement prices
- Volume and open interest
7. TradingView: Charting and Cross Market Analysis
TradingView serves a different purpose from sources such as EIA or USDA.
It is primarily useful for visualizing market prices and comparing markets.
Its futures section covers major energy, metals, and agricultural contracts, including crude oil, natural gas, gold, silver, copper, coffee, cotton, soybeans, and wheat. TradingView Futures Markets
That makes it useful for:
- Price trends
- Moving averages
- Support and resistance
- Volatility
- Volume
- Technical indicators
- Multiple time frames
- Comparing related markets
- Building watchlists
Where TradingView fits into fundamental analysis
TradingView can help answer:
How is the market reacting to the information?
Suppose EIA data shows that U.S. crude inventories are falling.
EIA provides the fundamental information. A charting platform can then show whether oil prices have responded, whether the move is accelerating, and how it compares with previous price behavior.
That combination is more useful than technical analysis or fundamental analysis on its own.
TradingView is therefore best treated as a market-analysis interface, not a replacement for primary commodity data.
8. Investing.com: Market Monitoring and Cross-Commodity Comparison
Investing.com is another broad market-monitoring platform. Its commodity section provides prices, charts, performance information, news, and market analysis across energy, metals, and agricultural commodities. Investing.com Commodities
Its main advantage is convenience.
An analyst can quickly move between crude oil, natural gas, gold, silver, copper, wheat, coffee, and other commodities without building a separate dashboard for every market.
Where it is most useful
Investing.com can help with:
- Quick price monitoring
- Cross-commodity comparisons
- Market news
- Basic chart analysis
- Futures monitoring
- Identifying markets that are moving unusually
It is particularly useful during the initial stage of research: identifying what is moving.
For the next step understanding why it is moving primary sources such as EIA, USDA, FAO, CFTC, exchanges, and the World Bank are generally more useful.
That distinction helps prevent a common research mistake: treating a market-data website as if it were the underlying source of the economic data.
9. London Metal Exchange: Industrial Metals and Warehouse Stocks
The London Metal Exchange is especially important for industrial-metal analysis.
LME provides market data for metals such as aluminum, copper, nickel, zinc, lead, and tin, along with information on prices, trading activity, and warehouse stocks. LME Market Data
Its warehouse reports provide information on stock levels, stock movements, cancelled warrants, live warrants, deliveries, and warehouse locations. LME Warehouse and Stocks Reports
Why are warehouse stocks useful?
They provide one window into physical metal availability within the exchange warehouse system.
Falling stocks can be consistent with tighter physical conditions, but they should not be interpreted in isolation. Analysts also need to consider mine production, smelter activity, demand, trade flows, and inventories outside the exchange system.
LME data is particularly useful for:
- Copper
- Aluminum
- Nickel
- Zinc
- Lead
- Tin
- Warehouse stocks
- Metal prices
- Open interest
For investors following industrial metals, LME data can therefore provide information that a general price chart cannot.
10. ICE: Energy and Agricultural Futures Data
Intercontinental Exchange, or ICE, operates major futures markets covering energy and agricultural commodities.
Its futures and options products include crude oil and refined products, natural gas, coffee, cocoa, cotton, sugar, metals, and other commodity-related contracts. ICE Futures and Options
ICE is particularly relevant when analyzing internationally important benchmarks and commodity-specific futures markets.
Where ICE fits into commodity research
ICE can help analysts examine:
- Futures prices
- Contract months
- Energy markets
- Agricultural futures
- Futures curves
- Market structure
For example, someone researching Brent crude may use ICE futures data alongside EIA supply and inventory statistics.
That creates a more complete picture of both the physical market and the financial market.
Fundamental Data vs. Market Analysis Tools
One of the easiest mistakes in commodity research is treating every tool as though it answers the same question.
It does not.
Fundamental data sources
These help explain the physical economy behind commodity prices.
Examples include:
- EIA
- USDA
- FAO
- World Bank
- LME warehouse data
They can help answer:
- Is production increasing?
- Are inventories falling?
- Is demand weakening?
- Are exports changing?
- Is a crop forecast deteriorating?
- Is physical supply becoming tighter?
Futures and market-data sources
These focus more directly on market pricing and participation.
Examples include:
- CME Group
- ICE
- CFTC
- TradingView
- Investing.com
They can help answer:
- What are futures contracts pricing?
- Is the futures curve in contango or backwardation?
- Is open interest changing?
- How are different trader groups positioned?
- Is the market price trending higher or lower?
The strongest analysis connects both sides.
Which Tools Are Useful for Different Commodities?
Different commodities require different research approaches.
| Commodity | Useful tools | Main information to watch |
| Crude oil | EIA, CME, ICE, CFTC, TradingView | Production, inventories, exports, futures curve |
| Natural gas | EIA, CME, CFTC, TradingView | Storage, production, weather, demand |
| Gold | CME, CFTC, World Bank, TradingView | Futures positioning, rates, dollar, investment demand |
| Copper | LME, CME, CFTC, TradingView | Warehouse stocks, production, demand, futures |
| Wheat | USDA, FAO, CME, CFTC | Crop conditions, production, exports, inventories |
| Corn | USDA, FAO, CME, CFTC | Acreage, yields, stocks, exports |
| Soybeans | USDA, FAO, CME, CFTC | Production, exports, stocks, weather |
| Coffee | FAO, ICE, TradingView, CFTC | Weather, production, exports, futures positioning |
| Aluminum | LME, World Bank, TradingView | Warehouse stocks, production, demand |
| Sugar | FAO, ICE, TradingView, CFTC | Production, weather, exports, futures positioning |
This is not a ranking. It simply matches common commodity-research questions with sources that can help answer them.
How to Combine Multiple Commodity Data Sources
The real advantage comes from combining tools rather than relying on one.
Consider a simple crude-oil research process.
Step 1: Check the price
Use a market-data platform such as TradingView or Investing.com to establish what crude oil has done and whether the move is unusual.
Step 2: Check the physical market
Use EIA data to examine inventories, production, imports, exports, and consumption.
Step 3: Check the futures curve
Use CME or ICE data to compare near-term and later contract prices.
Step 4: Check positioning
Use the CFTC COT report to see how major categories of futures participants are positioned.
Step 5: Check the broader environment
Use World Bank data and other macroeconomic sources to determine whether the move is part of a wider commodity trend.
At that point, the analyst has several independent pieces of information.
Instead of simply asking:
“Why did oil go up?”
the research process can ask:
“Did the physical market tighten, did futures pricing change, did positioning shift, and is the move consistent with the broader economic environment?”
That is a much stronger way to analyze a commodity.
What Commodity Analysis Tools Cannot Tell You
Even excellent data sources cannot predict commodity prices with certainty.
A chart cannot tell you exactly when a trend will reverse.
An inventory report does not guarantee that prices will rise when stocks fall.
A COT report cannot predict the next price move simply because speculative positioning is unusually high or low.
A crop forecast can change as weather conditions evolve.
A futures curve reflects current market pricing, but it is not a guaranteed forecast of future spot prices.
Commodity markets are exposed to unexpected events, including geopolitical disruptions, extreme weather, mine closures, policy changes, and shipping problems.
The role of an analysis tool is therefore to improve the quality of the information available not to eliminate uncertainty.
Building a Simple Commodity Research Workflow
You do not need to use every platform every day.
A practical workflow can start with four questions.
1. What is the price doing?
Use a reliable market-data or charting platform.
2. What is happening to supply and demand?
Use the primary source for that commodity, such as EIA for energy or USDA and FAO for agriculture.
3. What does the futures market show?
Check contract prices, different maturities, volume, open interest, and the shape of the futures curve.
4. What broader forces could change the outlook?
Consider interest rates, the U.S. dollar, economic growth, weather, geopolitics, trade restrictions, and transportation conditions.
Then add specialized sources when necessary.
A copper analyst might add LME warehouse stocks. An oil analyst may focus more heavily on EIA inventories and ICE Brent contracts. An agricultural analyst may put greater weight on USDA forecasts and FAO global trade data.
This approach is more efficient than opening dozens of websites without a clear research question.
The Best Commodity Analysis Tool Depends on the Question
There is no single tool that is best for every commodity or every type of analysis.
EIA is highly useful for energy fundamentals. USDA is important for agricultural supply-and-demand estimates, while FAO provides a broader global food-market perspective. The World Bank helps put commodity prices into a global macroeconomic context.
CFTC reports provide insight into futures positioning. CME and ICE provide important futures-market data. LME is particularly valuable for industrial metals and warehouse information. Trading View and Investing.com are useful for monitoring prices, charts, and market movements.
The important distinction is between watching a commodity price and understanding why it is moving.
A strong research process connects the two.
Price charts show the market’s reaction. Fundamental data helps explain the conditions behind that reaction. Futures markets show how prices differ across maturities, while positioning and inventory data add further evidence about market conditions.
That combination gives investors and analysts a much stronger foundation for understanding commodity markets.