
Telescope vs. Microscope: How Investors Are Looking at Earnings in 2026
How Investors Analyze Earnings?
A quarterly earnings report tells investors what a company has already done. The stock market, however, is usually trying to answer a different question:
What do these results tell us about the company’s future?
That is why investors can look at the same earnings report in two very different ways.
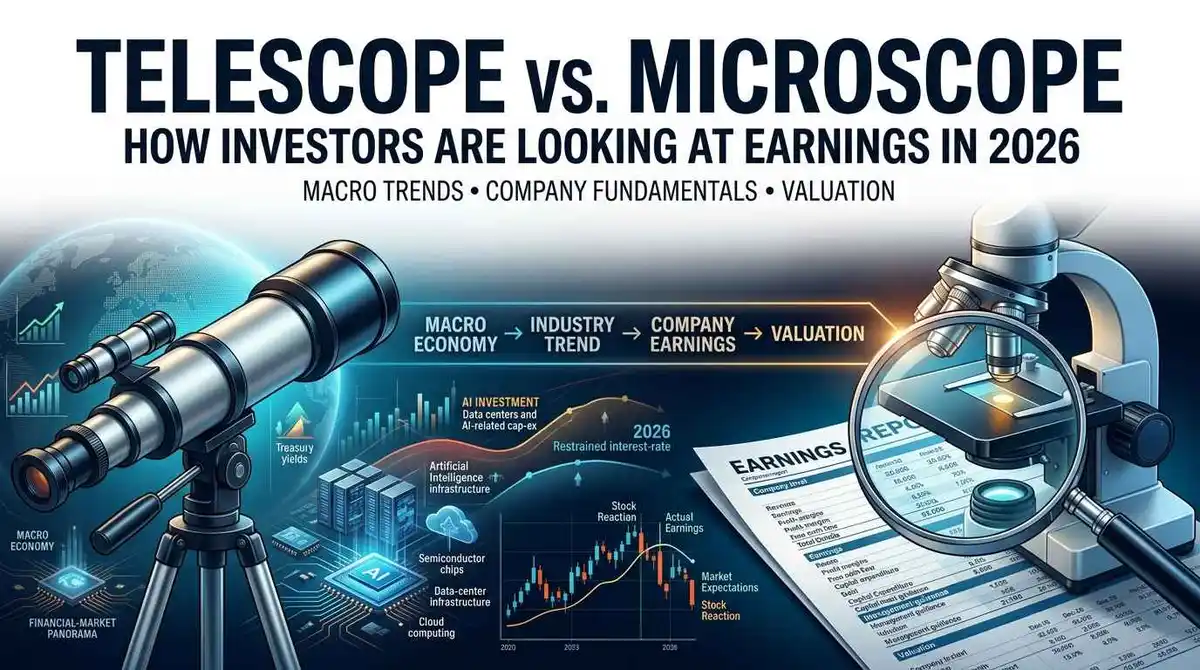
The microscope examines what is happening inside the latest numbers: revenue, margins, cash flow, costs, business segments and the reasons earnings changed.
The telescope looks farther ahead: future earnings, management guidance, capital spending, competitive pressures, industry demand and whether today’s investments can produce larger profits tomorrow.
In 2026, both views have become increasingly important.
The latest S&P 500 data illustrate why. FactSet reported on September 4 that analysts increased their aggregate third-quarter 2026 EPS estimate by 1.2% during July and August, from $88.64 to $89.69. That is unusual because analysts typically reduce estimates during the first two months of a quarter. The five-year average decline during that period is 1.7%.
Analysts also raised their full-year 2026 S&P 500 EPS estimate by 6.1%, to $361.38, during July and August. (FactSet Insight)
The market, in other words, is not looking only through the microscope at earnings already reported. It is increasingly using the telescope to judge what those earnings may become.
The Microscope: What Really Happened This Quarter?
The microscope begins with the latest results, but it does not stop at the headline EPS number.
Suppose a company reports revenue growth of 10% and earnings growth of 15%. That looks encouraging. But an investor still needs to ask what produced the improvement.
Did customers buy more?
Did the company raise prices?
Did margins expand?
Did costs fall temporarily?
Did a particular business segment drive most of the growth?
Did the company reduce its share count through buybacks?
These questions matter because two companies can report identical earnings growth while having completely different underlying businesses.
This is where how to read financial statements becomes useful. Investors can examine revenue, profitability, debt and cash generation together rather than treating quarterly EPS as a standalone number.
The microscope therefore asks:
What changed inside the business, and is that change economically durable?
That last question is critical.
A temporary cost reduction is not the same as sustainable productivity. A one-time price increase is not the same as lasting demand. And accounting profit is not automatically the same as strong cash generation.
The Telescope: What Does the Quarter Say About the Future?
The telescope starts where the microscope stops.
Instead of asking only whether the latest quarter was strong, investors ask:
What does this quarter change about the company’s future earnings power?
That means examining:
- Management guidance
- Revenue growth expectations
- Margin outlook
- Capital expenditure
- Industry demand
- Competitive position
- Analyst earnings revisions
- Expected returns on new investments
Guidance is particularly important because management is giving investors its view of the months ahead.
That makes an earnings report a bridge between the past and the future.
The microscope examines the quarter that just ended.
The telescope examines the assumptions embedded in the next several quarters.
Why an Earnings Beat Can Still Send a Stock Lower
This is where the two views connect.
Imagine analysts expect a company to earn $2.00 per share and it reports $2.10.
The company has beaten expectations.
But suppose the stock had already risen sharply because investors were expecting even stronger results, or because they believed future earnings would accelerate.
The stock can still fall.
The sequence is more important than the headline:
Earnings result → market expectations → management guidance → analyst revisions → valuation → stock reaction
A reported earnings beat is therefore only one piece of information.
The market is constantly comparing the company’s actual results with what was already reflected in the share price.
That is why an investor looking only through the microscope can miss an important part of the story.
The company may have performed well.
The stock may still be priced for something even better.
2026 Shows Why the Telescope Matters
The current earnings environment provides unusually clear evidence that investors are looking beyond reported results.
FactSet’s September 4 analysis showed that analysts raised third-quarter 2026 S&P 500 earnings estimates during July and August even as higher oil and gas prices created concerns about costs and inflation.
More importantly, the increase was not limited to a single quarter. Analysts raised the full-year 2026 EPS estimate by 6.1% during those two months. (FactSet Insight)
That is a telescope signal.
Analysts are effectively saying that the expected earnings power of the index has improved.
But investors still need the microscope.
If earnings estimates are rising, they need to know which companies and sectors are responsible, what is driving the improvement, and whether those drivers can continue.
The two perspectives therefore reinforce each other.
AI Spending Has Created a New Telescope Problem
Artificial intelligence makes this distinction particularly important in 2026.
Technology companies are spending heavily on data centers, chips, networking equipment and other infrastructure. These investments can reduce near-term free cash flow while potentially creating a much larger future revenue opportunity.
That creates a difficult question:
Are companies sacrificing today’s profits to build tomorrow’s earnings or simply spending faster than future returns can justify?
Alibaba provides a useful example.
In August, the company reported a 9% increase in quarterly revenue but a 75% decline in net profit, largely because it sharply increased AI-related capital expenditure. Reuters reported that Alibaba’s capital spending rose 75% year over year to 67.68 billion yuan in the quarter, while the company had already deployed roughly half of its planned 380 billion yuan AI investment for 2026–2029. (Reuters)
The microscope sees a dramatic decline in current profit.
The telescope asks a different question:
Can this spending create enough future AI and cloud revenue to produce attractive returns?
Alibaba has said it expects its AI investments to break even within three years, making the company’s future return on that spending an important part of the investment story. (Reuters)
This is not an argument that heavy AI spending is good or bad.
It shows why investors need to distinguish between near-term earnings pressure and long-term earnings potential.
The Microscope Looks at Margins. The Telescope Looks at Margin Durability.
Revenue growth attracts attention, but investors ultimately care about how much of that revenue becomes profit and cash.
Suppose two companies both increase sales by 15%.
Company A’s operating margin rises from 20% to 24%.
Company B’s margin falls from 20% to 16%.
Their revenue growth looks identical.
Their economic trajectories are not.
The microscope identifies the margin change.
The telescope asks whether the new margin level can persist.
That second question matters because margins can be affected by labor costs, energy prices, tariffs, financing costs, pricing power and investment requirements.
In September, for example, rising oil prices were creating renewed inflation concerns for markets. Reuters reported that Brent crude moved above $100 a barrel as geopolitical tensions intensified, putting additional pressure on the inflation and interest-rate outlook. (Reuters)
For investors, that creates another telescope question:
If input costs remain higher, how much of a company’s future earnings growth survives?
Cash Flow Adds Another Layer
The microscope should also examine the relationship between reported earnings and cash generation.
A company can report strong net income while spending heavily on inventory, acquisitions, property, equipment or AI infrastructure.
That is not automatically a warning sign. Growing businesses often need to invest.
The important question is what the investment is expected to produce.
This is especially relevant for companies building expensive AI infrastructure.
The microscope asks:
How much cash is the company spending today?
The telescope asks:
What level of future revenue and profit would make that spending worthwhile?
This distinction helps investors avoid two opposite mistakes.
One is assuming that every large investment is wasteful because it hurts current cash flow.
The other is assuming that every investment will eventually produce enormous profits simply because the technology is popular.
Both require evidence.
The Telescope Does Not Stop at Earnings. It Reaches Valuation.
Even a credible forecast of higher future earnings does not automatically make a stock attractive.
The telescope must eventually look at the price investors are paying for that future.
Investor.gov defines the price-to-earnings ratio as the current stock price divided by earnings per share. It is one way investors compare a company’s share price with its earnings. (Investor.gov)
Consider a simple example.
A company increases EPS from $5 to $6-a 20% increase.
That sounds excellent.
But if investors were already paying a very high valuation because they expected rapid growth, the stock may not rise much. The market may decide that the company’s future growth is already reflected in the price.
This is where the telescope becomes more sophisticated.
It does not ask only:
How much will earnings grow?
It asks:
How much growth is already priced into the stock?
Economic Reader’s guide to how business valuation works provides more context on how growth, profitability, cash flow and expectations influence valuation.
2026 Earnings Are Strong but Expectations Are Rising Too
The current U.S. earnings backdrop illustrates both sides of the equation.
Reuters reported in September that 86% of the 492 S&P 500 companies that had reported second-quarter results exceeded analyst earnings estimates, compared with a long-term average of 67.5%. Barclays subsequently raised its 2026 S&P 500 EPS forecast from $337 to $365, citing strong corporate earnings and continued AI investment. (Reuters)
That is encouraging through the telescope.
But stronger earnings expectations can also create a higher bar for companies.
When investors become accustomed to earnings beats, a merely good result may no longer be enough to move a stock higher.
That is one reason valuation and expectations matter so much.
A company does not compete only against its previous quarter.
It competes against what investors already believe will happen next.
What Investors Should Look for in an Earnings Report
A useful approach is to move through the report in four stages.
1. Use the microscope: What happened?
Look beyond EPS.
Examine revenue growth, margins, segment performance, cash flow, capital expenditure and major changes in costs.
The goal is to identify the real drivers behind the quarter.
2. Move from the microscope to the telescope: Why did it happen?
Was growth caused by stronger demand, higher prices, acquisitions, currency effects or temporary factors?
This is where investors begin separating sustainable growth from a short-term boost.
3. Use the telescope: What happens next?
Read management guidance and listen for changes in demand, pricing, margins, investment plans and competitive conditions.
Then compare those comments with analyst estimates.
Rising estimates can indicate improving expectations. Falling estimates can reveal that investors may need to lower their assumptions.
4. Look through the telescope at the stock price
Finally, ask whether the current valuation already assumes strong future performance.
A company can have excellent earnings and still be an expensive investment.
A disappointing quarter can also create an opportunity if the long-term earnings outlook remains stronger than the current share price suggests.
The key is not simply finding good or bad earnings.
It is understanding the difference between business performance and market expectations.
The Two Views Investors Should Never Separate
The microscope and telescope are not competing approaches.
They are two halves of the same analysis.
The microscope protects investors from being distracted by a headline earnings number.
The telescope protects them from becoming trapped by the past.
The microscope asks:
What is happening inside the business right now?
The telescope asks:
What could those results mean for future earnings and valuation?
In 2026, that distinction matters more because companies are making unusually large investments in technologies such as AI while simultaneously facing changing energy costs, trade conditions, interest rates and geopolitical risks.
Strong current earnings are useful evidence.
But they are not the entire investment case.
The real test is whether today’s earnings can become durable, profitable and cash-generating earnings in the future and whether the stock price already assumes that success.
That is why the best earnings analysis does not choose between the microscope and the telescope.
The microscope prevents investors from being fooled by the headline. The telescope prevents them from being trapped by the past. And valuation tells them whether the future they see is already priced into the stock.