Oil Market Monthly Review: October 2026
Oil Market Monthly Review October 2026
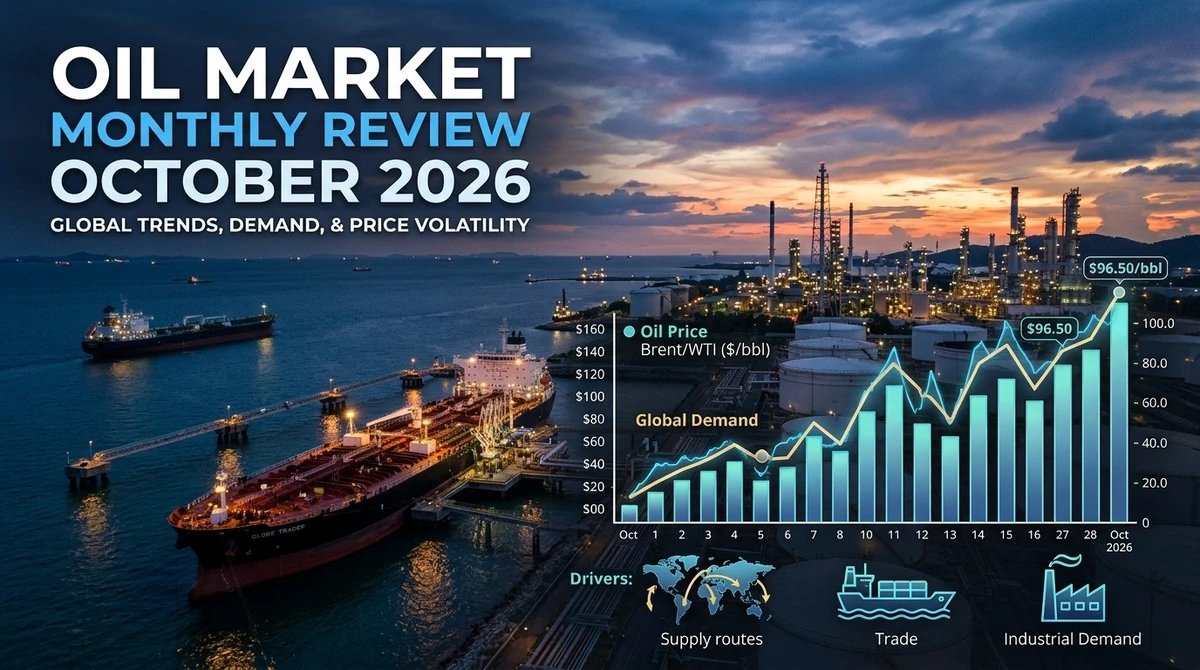
Oil prices climbed sharply in October as the market struggled to reconcile recovering crude exports with continuing risks to Middle Eastern shipping routes. Production was returning in parts of the Gulf, but attacks on tankers, elevated freight costs, and uncertainty surrounding the Strait of Hormuz made the reliability of those supplies a central concern.
By October 30, Brent crude futures had gained 13.6% for the month, while U.S. West Texas Intermediate (WTI) had risen 15.2%. Both benchmarks reached their highest settlement levels since late April. The rally reflected more than concerns about how much oil producers could extract. It also reflected whether that oil could reach refineries and consumers without costly delays or disruption.
October’s market was therefore defined by a widening distinction between available production and dependable deliveries. That distinction shaped prices, refinery economics, and the outlook for fuel consumption.
A Strong Month for Both Oil Benchmarks
On October 30, December Brent futures settled at $117.64 per barrel, up 2.4% during the session. The contract expired that day. The more actively traded January Brent contract settled at $113.43, while U.S. WTI futures finished at $104.12, gaining 2.08%.
For October as a whole, Brent advanced 13.6% and WTI rose 15.2%, according to Reuters. The final-session prices need to be interpreted carefully: comparing the expiring December Brent contract with January Brent or WTI can produce misleading conclusions about the market’s price relationships.
Using the January Brent contract, the Brent-WTI difference at the October 30 settlement was approximately $9.31 per barrel. That premium reflected the international benchmark’s exposure to global seaborne supply risks, while WTI remained more directly connected to U.S. production, storage, pipeline capacity, and export conditions.
The monthly gains were substantial, but the underlying market was not uniformly short of crude. Instead, traders were pricing the possibility that further disruption could prevent recovering production from translating into reliable global supply.
The Strait of Hormuz Made Transportation a Pricing Issue
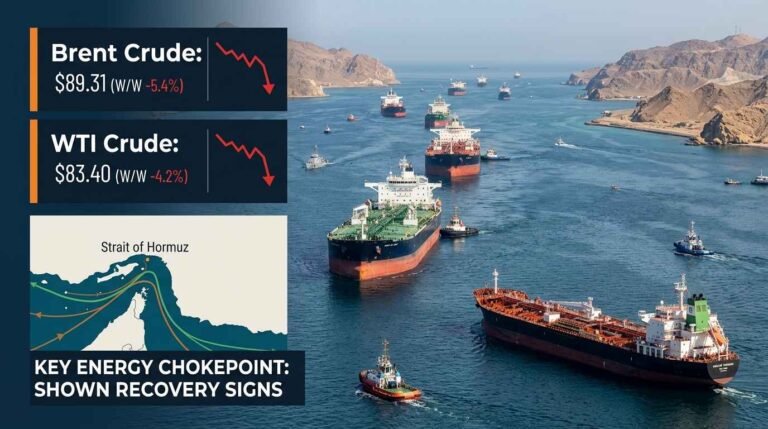
The Strait of Hormuz remained central to the oil market because it connects major Gulf exporters with international buyers. Disruption in this narrow shipping corridor can affect crude deliveries, refined-product exports, tanker availability, and insurance costs.
The International Energy Agency’s October Oil Market Report showed that crude exports from Gulf producers increased by 4.4 million barrels per day to 13.9 million barrels per day in September. The recovery brought exports to more than 75% of pre-war levels. Increased flows through alternative routes and ship-to-ship transfers also helped restore some supply.
However, the recovery remained vulnerable. The IEA warned that renewed attacks on regional energy infrastructure and tanker traffic were threatening further gains. It also reported that record freight costs were raising delivery expenses and squeezing refinery margins in Europe and Asia.
The risks became more visible toward the end of October. On October 30, a tanker was struck by explosive devices in the Strait of Hormuz. Reuters reported that the incident renewed concerns about a possible escalation in the conflict involving Iran and the security of regional oil shipments.
This helps explain why rising exports did not automatically push prices lower. A barrel produced in the Gulf is not equivalent to a barrel delivered to a refinery on schedule. When shipping becomes more expensive or less reliable, buyers may compete more aggressively for supplies that can reach them safely.
OPEC+ Production Targets Faced Practical Limits
OPEC+ decisions influenced the supply outlook, but production targets alone could not resolve the transportation problem.
On September 6, seven participating OPEC+ countries Saudi Arabia, Russia, Iraq, Kuwait, Kazakhstan, Algeria, and Oman decided to maintain their September production requirements for October. At their October 4 meeting, the same group decided to maintain those requirements for November as well.
The decisions reflected a cautious approach to production adjustments while the market remained exposed to geopolitical uncertainty. However, required production levels and actual oil reaching international buyers are two different measures.
The IEA estimated that global oil supply increased by 2.5 million barrels per day month over month to 102.3 million barrels per day in September. OPEC+ accounted for 2.1 million barrels per day of that increase, led by Saudi Arabia. These are September production figures reported in October, not a complete measure of October output.
The distinction is important for interpreting the month’s price rally. Higher production from Saudi Arabia and other Gulf producers supported the supply recovery, but shipping disruptions and infrastructure risks limited the market’s confidence that the improvement would continue.
OPEC+ can adjust production requirements, but it cannot independently guarantee safe tanker passage, restore damaged infrastructure, or eliminate higher insurance and freight costs. Those constraints made the physical supply outlook more complicated than the production figures alone suggested.
High Prices Were Beginning to Weaken Oil Demand
The supply risks supporting prices were also creating pressure on consumers. Higher crude costs feed into gasoline, diesel, jet fuel, shipping, and industrial production, although the timing and scale of the effect vary by region.
The IEA’s October report forecast that global oil demand would decline by 2.6 million barrels per day on average in 2026. It expected demand to fall by 2.5 million barrels per day year over year in the fourth quarter, with diesel accounting for approximately one-quarter of the decline.
Diesel is particularly important because it powers freight transportation, agricultural machinery, construction equipment, and industrial operations. When diesel becomes expensive or difficult to obtain, businesses may reduce activity, pass higher costs to customers, or delay purchases.
The IEA also projected that global refinery runs would reach a seasonal low of 81.3 million barrels per day in October before recovering toward 84.6 million barrels per day by year-end. These were forecasts in the October report, not final October operating figures.
The demand outlook creates a limit to the price rally. If expensive fuel persists, consumers and businesses have incentives to conserve energy, reduce travel, improve efficiency, or switch fuels where possible. A prolonged supply shock can therefore eventually weaken the demand that supports oil prices.
U.S. Inventories Showed a Mixed Domestic Picture
U.S. petroleum inventories offered a useful view of how the international rally interacted with domestic supply and demand.
The Energy Information Administration reported that commercial crude inventories fell by 1.9 million barrels to 410.6 million barrels in the week ending October 23. Distillate stocks declined by 1.5 million barrels to 102.8 million barrels, while gasoline inventories increased by 3.9 million barrels to 209.2 million barrels.
The figures did not point in one direction across every fuel category. Lower crude and distillate stocks indicated tighter availability in those areas, while the increase in gasoline inventories suggested a different balance in the motor-fuel market.
U.S. crude exports rose by 1.4 million barrels per day to 4.85 million barrels per day during the reporting week. At the same time, total petroleum product supplied a broad indicator of domestic demand fell by approximately 1.022 million barrels per day.
The inventory report therefore needs to be read alongside trade and refinery data. A fall in crude stocks can reflect higher exports, changes in imports, refinery demand, or several factors at once. It does not automatically mean that U.S. consumers are using more fuel.
For ongoing monitoring, the EIA Weekly Petroleum Status Report provides regular updates on crude stocks, gasoline, distillates, imports, exports, and refinery activity.
What the Brent-WTI Difference Revealed
The two major benchmarks respond to overlapping but different market conditions.
Brent is the international reference price for much of the seaborne crude market. Its value is particularly sensitive to disruptions affecting exports from major producing regions. WTI, by contrast, reflects conditions in the U.S. domestic market, including production, storage, pipeline access, refinery demand, and export capacity.
October’s price performance showed that both benchmarks were exposed to the same broad supply concerns, but their monthly gains differed. WTI rose 15.2%, compared with Brent’s 13.6%. At the October 30 settlement, January Brent traded $9.31 above WTI.
That difference matters to U.S. producers and refiners. A wider Brent premium can improve the economics of exporting U.S. crude, provided transportation and other costs do not absorb the advantage. Refiners also compare the cost of domestic and imported grades when deciding which crude to process.
For readers exploring how energy products fit into the wider trading system, Economic Reader’s guide to the world’s major commodity exchanges explains the role of exchanges in price discovery and commodity trading.
Three Scenarios That Could Shape November
November’s oil market will depend on how the supply recovery, transportation risks, and demand outlook develop.
If Middle Eastern shipping disruptions intensify: Further attacks or restrictions around the Strait of Hormuz could raise tanker costs and delay deliveries. Even without a comparable fall in production, the market could face tighter prompt supply and renewed upward pressure on international crude prices.
If Gulf production and exports recover more reliably: Higher output, safer shipping, and lower freight costs could allow more crude to reach refiners. That would reduce the geopolitical premium in prices, although the pace of recovery would still depend on infrastructure and export capacity.
If high fuel costs weaken consumption further: Continued pressure on diesel, transport, and industrial activity could reduce demand. That would partly offset supply risks and could limit price gains, particularly if inventories begin rebuilding.
These scenarios are not mutually exclusive. The market could experience improving exports while demand remains weak, or higher geopolitical risk while some producers continue increasing output. November prices will reflect which force has the greater effect on the barrels buyers can actually obtain.
October’s Central Lesson: Supply Is About Delivery, Not Just Production
October showed why oil prices cannot be understood through production figures alone. Gulf output and exports recovered during September, but shipping risks, high freight costs, and uncertainty around regional infrastructure kept the global supply outlook fragile.
At the same time, expensive fuel threatened to weaken demand, while U.S. inventory data revealed different conditions across crude, gasoline, and distillate markets. The difference between Brent and WTI also demonstrated how international supply risks and domestic U.S. conditions can influence benchmarks in distinct ways.
As November begins, the key question is whether recovering production can translate into dependable deliveries at lower cost. Until that becomes clearer, the oil market will remain sensitive not only to how much crude is produced, but also to where it can travel, how quickly it can arrive, and whether consumers can continue paying for it.
Read the Oil Market Monthly Review: September 2026 for more details.